
By Armstrong Subero
Mathematics and programming go hand in hand. If you are a programmer, at some point you will have to use mathematics.
Data science, machine learning, artificial intelligence, and cryptocurrencies are all based on complex underlying mathematical principles.
However, using math functions doesn't have to be complex! Python abstracts everything away, so once you understand the concepts, you will not need to understand the full details of the implementation.
Math doesn't have to be scary
There are a lot of mathematical functions you will come across. If you are working with data or analytics, it's important that you understand some mathematical principles and functions.
One such function you must understand is the mean function.
Don't be put off by the name – there is nothing mean (pun intended) about the mean function in Python.
This post is self contained, but I expect you have some experience working with Python and that you know what a Python list is. If not, check out this article before moving on.
Once you're finished, come back and join me for a deep dive into the mean function.
Statistics
So you want to learn about the mean function. That's great! But before we look at this function its important to look at the discipline from which it originates: statistics.
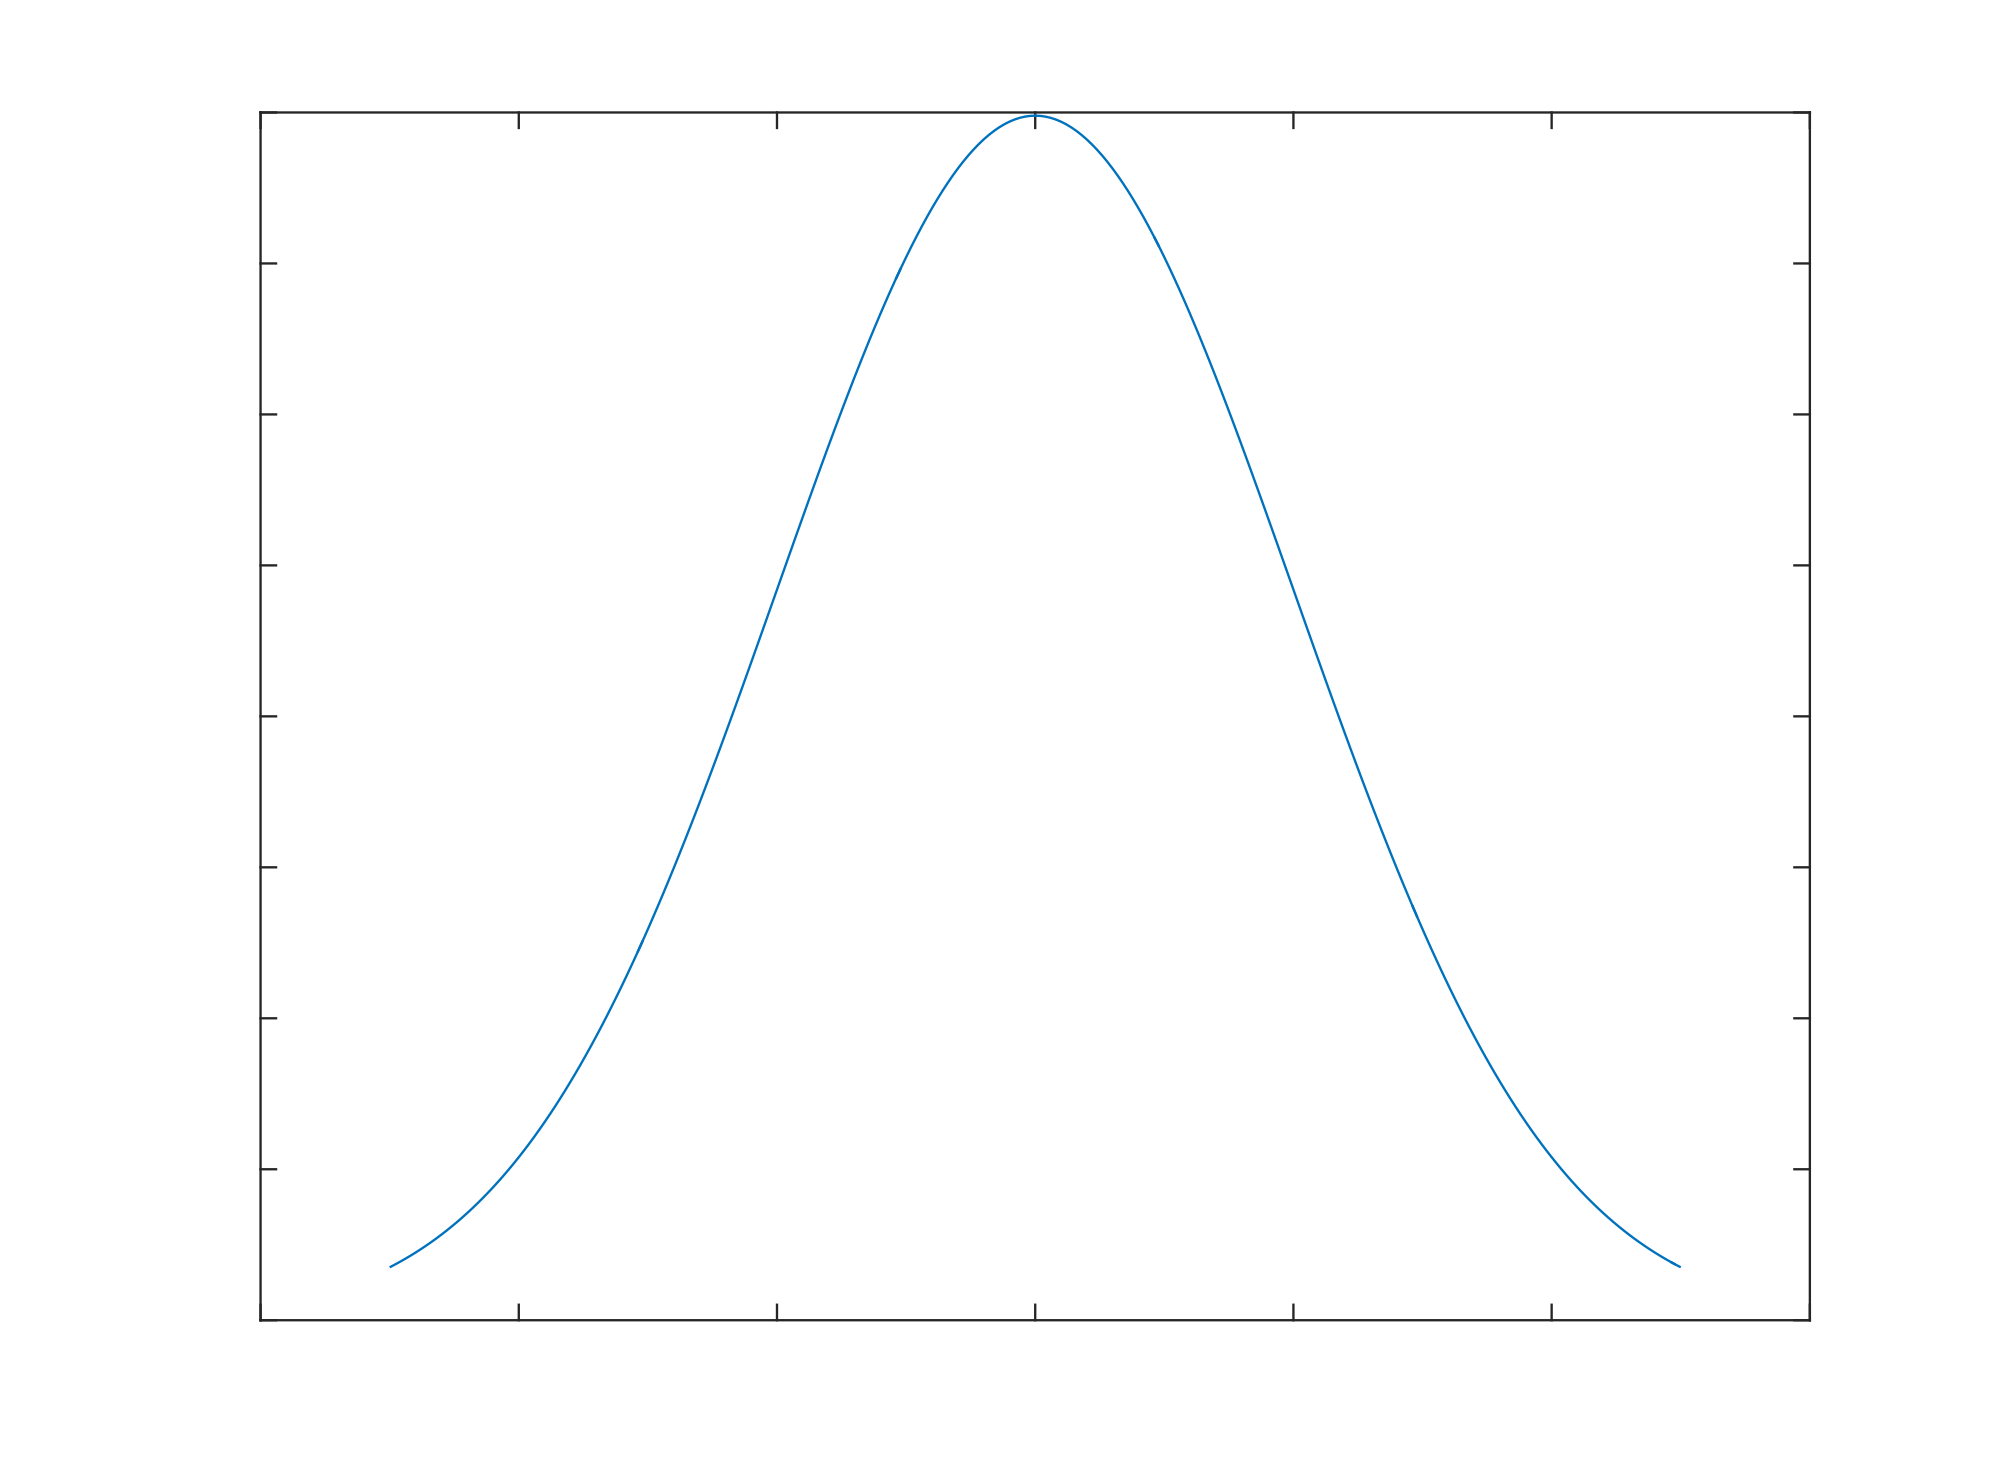
 Statistics has tools like this
In the image above we see a graph. A graph is a pictorial representation that shows the relationship of one variable in relation to another.
Graphs are useful because they allows us to organize data so that we can quickly see trends and relationships between the data. A graph is just one tool that we can use to visualize and analyze data.
Statistics is a branch of mathematics that allows us to have a systematic way of classifying, analyzing and interpreting data. This is important because with statistics, we have a collection of ready made tools to do each of those things.
Imagine if you needed to reinvent a saw every time you needed to cut a piece of wood. We would many people calling saws by different names, even though they do the same thing. To avoid this problem, we gave the saw a name that everyone can refer to it by.
The same happens in statistics — we have tools well known tools that everyone is familiar with. One such tool is the mean.
Mode, Median and Mean
Though mean is perfectly capable of standing on its own, it's usually taught as part of a trio, which includes the mode, median, and mean.
Let's look at a group of numbers so you'll understand what is happening here. Imagine you have the numbers below:
1, 2, 3, 3, 4, 6, 9
Say we wanted to express which number occurs the most times. It would be 3, and the name we give this property is mode. The mode is the number which is the most frequent in a set we are examining.
The number in the middle of an ordered set is called the median. To find the median of a numerical set, arrange the numbers from smallest to largest and then look at the number in the middle. The set of numbers above is already arranged from least to greatest, so the median number is also 3.
Finally, the mean is another way to refer to the average of the set. To find the mean, just add all the numbers together and divide it by the total number of elements in the set. In the case of the numbers above, if we add them all together, we get 28. The total number of items in the set is 7, so our mean is 4.
Why Do We Need the Mean?
So at this point you may be wondering why would we need to find the mean of a number anyway.
The thing is, even statistics itself is subdivided into several groups. Just as you have tools that are used for working with wood and others for working with metal, some tools in statistics are grouped into classes since they are used for a similar purpose.
One such group in statistics is called summary statistics. One of the things statistics is used for is to describe data, and summary statistics is a collection of tools used for that purpose. One of the items in that class of tools is the mean.
The mean is important due to helping us analyze what is known as a distribution. In statistics, a distribution is a method we use to look at a variable we want information on. Using a distribution we will look at the values of this variable and how often it occurs.
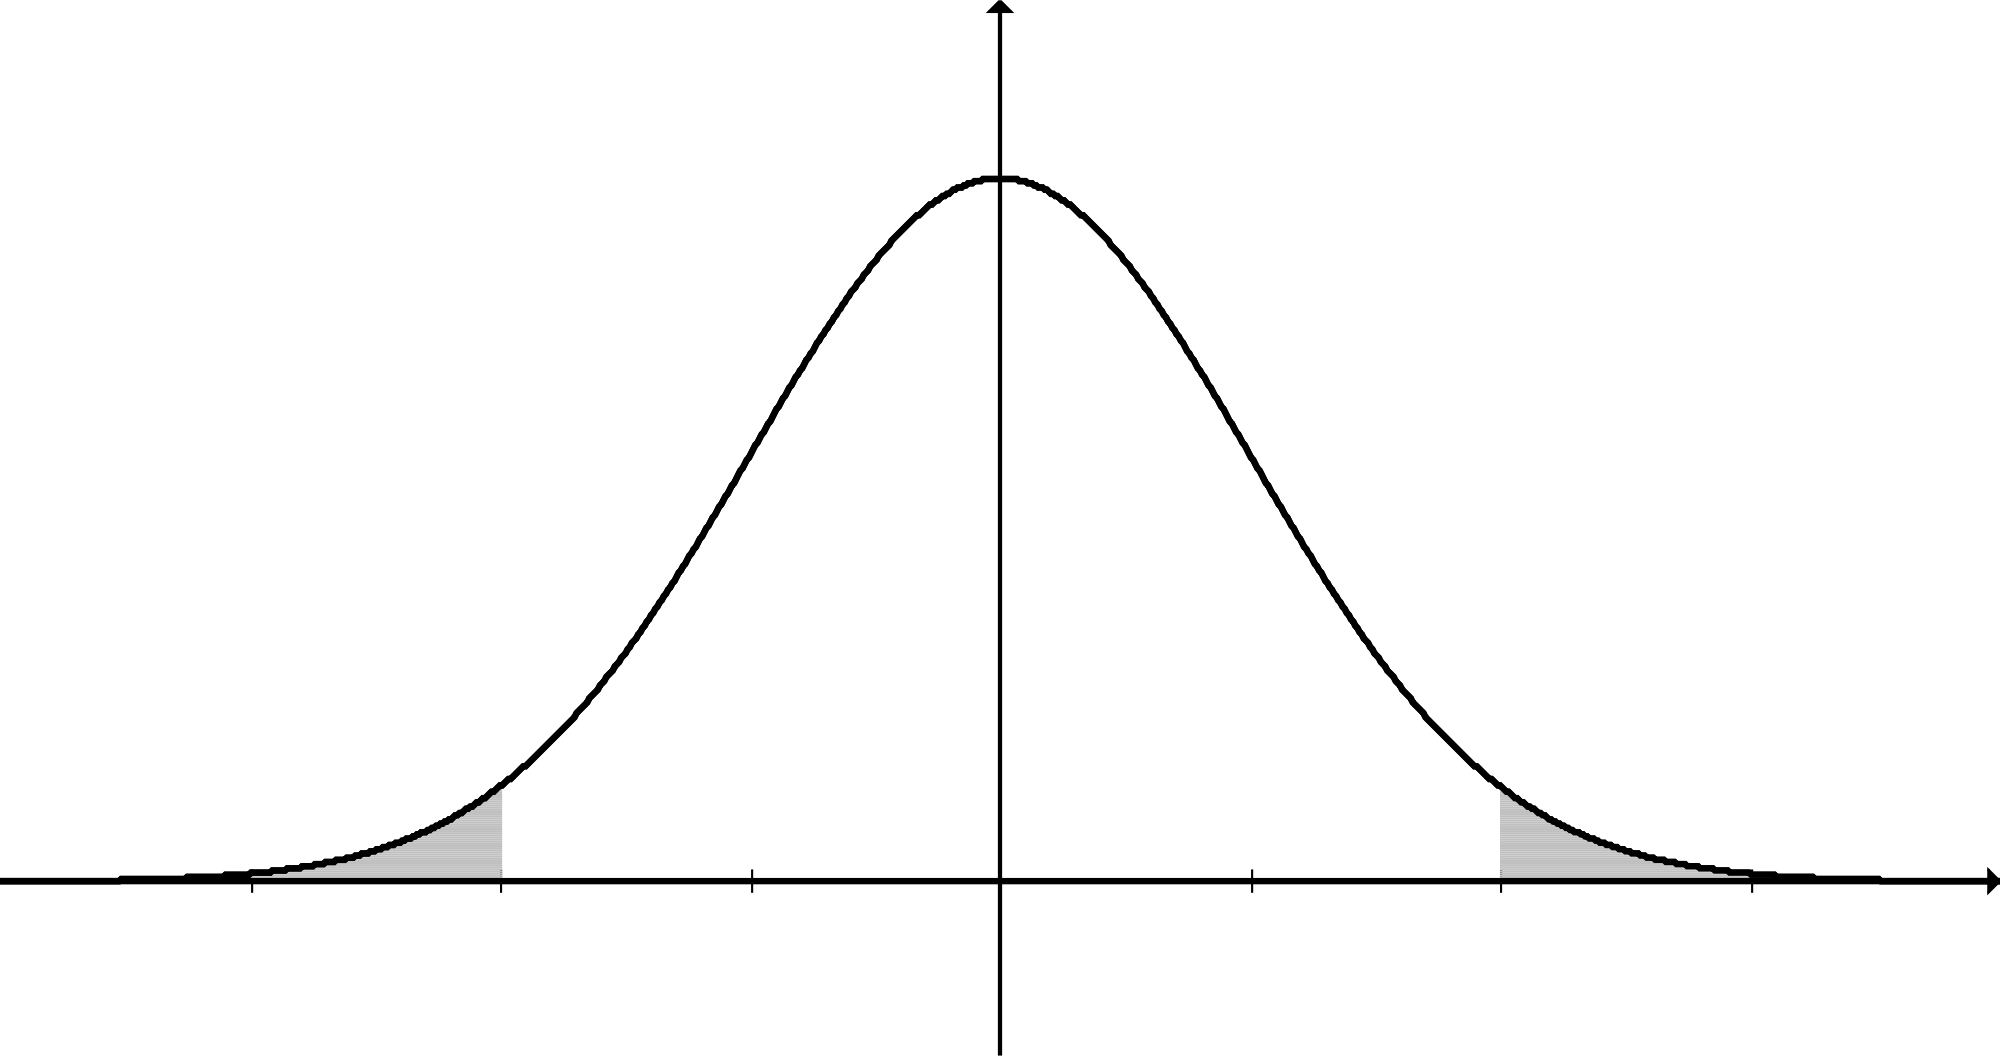
If we collect data, a common type of distribution we see is the normal distribution which takes the form of the bell curve:
 The normal distribution
That is to say the variable will have a common value toward which it tends, as well as a starting point and an end point.
What the mean does is that it allows us to take a distribution like this and look at the central tendency of the variable, which is the point at which the values of the variable tend to cluster.
Thus we can say the mean describes the central tendency of the distribution.
Calculating the Mean in Python
We can manually calculate the mean if we have a small numerical data set it we have a few values to work with. However, when we have hundreds or thousands of values in a data set it becomes impossible to calculate it by hand.
Since Python is a "batteries included" language, the way we can do this is to use the mean function of the statistics module within Python.
Let's use the mean function to calculate the mean of the numerical data set we had earlier in the post:
# 1. import the statistics module
import statistics

# 2. list containing our numerical data set
numerical_data_set = [1, 2, 3, 3, 4, 6, 9]

# 3. calculate the mean
calc_mean = statistics.mean(numerical_data_set)

# 4. print our calculated mean
print("Mean is: ", calc_mean)
Our code consists of a 4 step sequence that we can use to calculate the mean:
- We import the statistics module that contains our mean function
- We create a Python list containing the numerical data set of which we would like to calculate the mean
- We calculate the mean and store the result in a variable,
calc_mean - We output our calculated mean so that we can get visual feedback
When we run the code, we will get the following output:
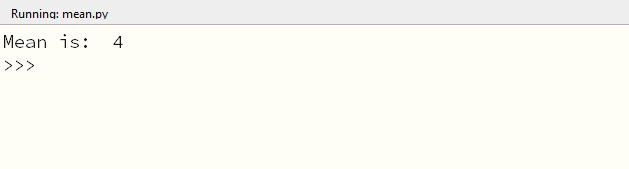 Our result
The program outputs the same value as our manual calculations. When we are working with large data sets, this function will be able to scale to handle whatever we can throw at it.
Wrapping Up
In this post we looked at the mean function in Python. We began by discussing statistics as a whole, then took a deep dive into mean.
Now that you have a solid understanding of statistics and the mean function in Python, you can use it in your own programs.
If you liked this article, then you may also be curious about learning about data structures and algorithms. If you want a simple, clear, step by step guide to learning about data structures and algorithms without having to write a single line of code, then you can check out the book Codeless Data Structures and Algorithms.
Read the book here: