

In this article, you'll learn how to use markers in Matplotlib to indicate specific points in a plot.
The marker parameter can be used to create "markers" in a plot. You can specify the shape of the marker by passing a value to the parameter.
Here's what a normal Matplotlib plot looks like:
import matplotlib.pyplot as plt
import numpy as np

x = [2,4,6,8]
y = [1,3,9,7]

plt.plot(x,y)
plt.show()
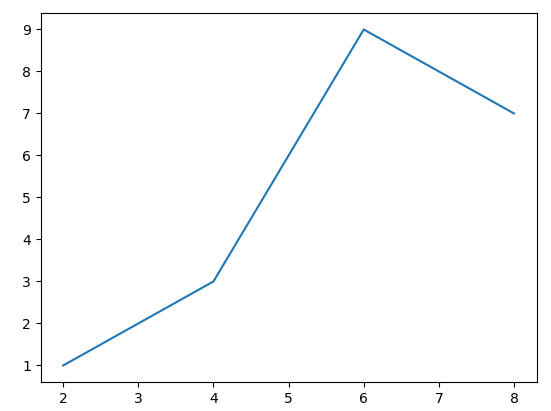 a matplotlib plot without a marker
Here's a plot with a marker:
import matplotlib.pyplot as plt
import numpy as np

x = [2,4,6,8]
y = [1,3,9,7]

plt.plot(x,y, marker = 'o')
plt.show()
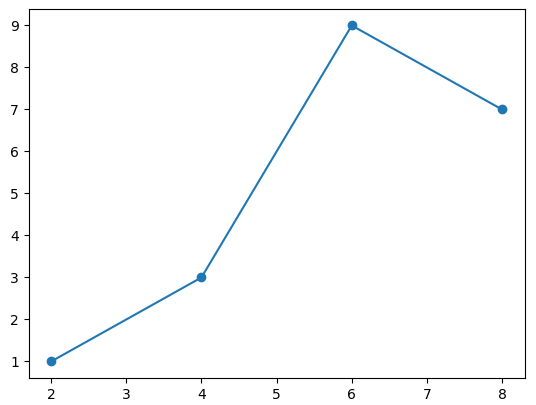 a matplotlib plot with an "o" marker
As can be seen in the image above, every meeting point for both axis in the plot is denoted by a marker that looks like an circle.
We're able to do that by setting the value of the marker parameter to "0": plt.plot(x,y, marker = 'o').
List of Matplotlib Markers
Here is a list (from the Matplotlib documentation) of marker values that can be assigned to the marker parameter:
| Marker | Description |
| "." | point |
| "," | pixel |
| "o" | circle |
| "v" | triangle_down |
| "^" | triangle_up |
| "<" | triangle_left |
| ">" | triangle_right |
| "1" | tri_down |
| "2" | tri_up |
| "3" | tri_left |
| "4" | tri_right |
| "8" | octagon |
| "s" | square |
| "p" | pentagon |
| "P" | plus (filled) |
| "h" | hexagon1 |
| "H" | hexagon2 |
| "+" | plus |
| "*" | star |
| "x" | x |
| "X" | x (filled) |
| "D" | diamond |
| "d" | thin_diamond |
| "_" | hline |
| "s" | square |
| 0 | tickleft |
| 1 | tickright |
| 2 | tickup |
| 3 | tickdown |
| 4 | caretleft |
| 5 | caretright |
| 6 | caretup |
| 7 | caretdown |
| 8 | caretleft (centered at base) |
| 9 | caretright (centered at base) |
| 10 | caretup (centered at base) |
| 11 | caretdown (centered at base) |
This list above shows the different values you can use to change the style of a marker in a plot.
Summary
In this article, we talked about markers in Matplotlib. They can be used to mark/indicate specific points in a plot.
We saw some code examples showing the application of the marker parameter.
Lastly, we saw a list of marker values that can be used to change the style of a marker.
Happy coding!