By Adebola Adeniran
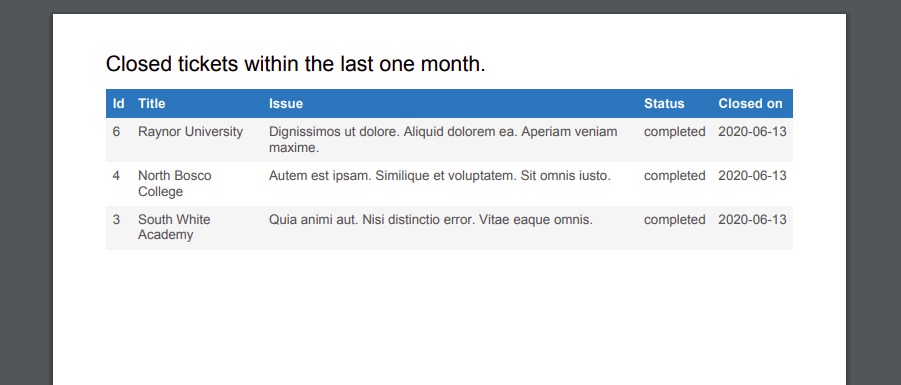
In this article, we'll be building a button that generates a PDF document (like you see above) based on data from an API call.
A couple of days ago, I built a full stack CRM application to manage communication between customers and support agents.
I needed a way for agents to generate a summary of closed tickets as a PDF file. After searching across the internet for an EASY way to do this, I dare say this article will show you the easiest way out there.
Let's get into it, shall we?
Setup packages
First, let's install the packages we need.
npm i jspdf jspdf-autotable
Define a function to generate the PDFs
Next, let's define a function that we can call anywhere to generate a PDF for us. I've added a lot of comments to help you understand what is going on with each line.
// services/reportGenerator.js

import jsPDF from "jspdf";
import "jspdf-autotable";
// Date Fns is used to format the dates we receive
// from our API call
import { format } from "date-fns";

// define a generatePDF function that accepts a tickets argument
const generatePDF = tickets => {
  // initialize jsPDF
  const doc = new jsPDF();

  // define the columns we want and their titles
  const tableColumn = ["Id", "Title", "Issue", "Status", "Closed on"];
  // define an empty array of rows
  const tableRows = [];

  // for each ticket pass all its data into an array
  tickets.forEach(ticket => {
    const ticketData = [
      ticket.id,
      ticket.title,
      ticket.request,
      ticket.status,
      // called date-fns to format the date on the ticket
      format(new Date(ticket.updated_at), "yyyy-MM-dd")
    ];
    // push each tickcet's info into a row
    tableRows.push(ticketData);
  });


  // startY is basically margin-top
  doc.autoTable(tableColumn, tableRows, { startY: 20 });
  const date = Date().split(" ");
  // we use a date string to generate our filename.
  const dateStr = date[0] + date[1] + date[2] + date[3] + date[4];
  // ticket title. and margin-top + margin-left
  doc.text("Closed tickets within the last one month.", 14, 15);
  // we define the name of our PDF file.
  doc.save(`report_${dateStr}.pdf`);
};

export default generatePDF;
Create a component to save the tickets to be rendered
Now, let's create a simple Component that fetches and saves the ticket to state.
import React, { useEffect, useState } from "react";
import generatePDF from "../services/reportGenerator";

const Tickets = () => {

  const [tickets, setTickets] = useState([]);


  useEffect(() => {
    const getAllTickets = async () => {
      try {
        const response = await axios.get("http://localhost:3000/tickets");
        setTickets(response.data.tickets);
      } catch (err) {
        console.log("error");
      }
    };
    getAllTickets();
  }, []);

const reportTickets = tickets.filter(ticket => ticket.status === "completed");

  return (
    <div>
      <div className="container mb-4 mt-4 p-3">
        <div className="row">
          {user.user.role === "user" ? (
            <> </>
          ) : (
            <button
              className="btn btn-primary"
              onClick={() => generatePDF(reportTickets)}
            >
              Generate monthly report
            </button>
          )}
        </div>
      </div>
      <TicketsComponent tickets={tickets} />
    </div>
  );
};

export default Tickets;
A few points about our <Tickets /> component. When our component loads, we make a request to http://localhost:3000/tickets to fetch all our tickets. We then save them to the tickets state. And finally, we pass them as a prop to the <TicketsComponent /> to render the tickets in the DOM.
We also have a reportTickets variable that filters our tickets to get only the tickets that have the status of completed.
Notice that we also created the Generate Monthly Report button that calls the generatePDF() function that we defined earlier when clicked.
Create a component to display the tickets in a table
Next, let's define our <TicketsComponent /> that will be responsible for displaying our tickets in a nice looking table. Remember that it accepts the tickets to be displayed as a prop from the <Tickets /> component.
import React from "react";
import { Link } from "react-router-dom";

const TicketsComponent = ({ tickets }) => {

// a function that assigns bootstrap styling classes based on
// the status of the ticket
  const assignColorToTicketStatus = ticket => {
    if (ticket.status === "completed") {
      return "p-3 mb-2 bg-success text-white";
    } else if (ticket.status === "in_progress") {
      return "p-3 mb-2 bg-warning text-dark";
    } else if (ticket.status === "opened") {
      return "p-3 mb-2 bg-light text-dark";
    }
  };
  return (
    <div className="container">
      {tickets.length === 0 ? (
        "You currently have no tickets created"
      ) : (
        <table className="table">
          <thead>
            <tr>
              <th scope="col">#</th>
              <th scope="col">Title</th>
              <th scope="col">Issue</th>
              <th scope="col">Status</th>
              <th scope="col"></th>
            </tr>
          </thead>
          <tbody>
            {tickets.map(ticket => (
              <tr key={ticket.id}>
                <td>{ticket.id}</td>
                <td>{ticket.title}</td>
                <td>{ticket.request}</td>
                <td className={assignColorToTicketStatus(ticket)}>
                  {ticket.status}
                </td>
                <td>
                  <Link to={`/ticket/${ticket.id}`}>See comments</Link>
                </td>
              </tr>
            ))}
          </tbody>
        </table>
      )}
    </div>
  );
};

export default TicketsComponent;
Now, let's see what our application currently looks like. We have 10 tickets in our state but I'll show 6 here for convenience.

As you can see, we have a number of tickets at different statuses. We also have our Generate monthly report button that, when clicked, will export the PDF file.
And that's it. You should end up with a PDF file with the filename in the form _report_dddmmyyyy_ downloaded in your browser.
If this article helped you out, say hello on twitter.