

Creating system architecture design diagrams is an important part of technical documentation. As system complexity grows, clarity within teams becomes even more important.
But creating diagrams from scratch using canvas-like tools isn't always efficient.
Luckily, there's an alternative way to create diagrams using a diagram-as- code approach. In this approach, you explain the diagram components using a predefined syntax instead of drawing them.
Table of Contents
Benefits of Diagram-as-Code:
Changes are tracked via version control.
Saves time as drawing from scratch or a tool takes time due to manual formatting.
Most diagram-as-a-code tools support standard tech icons like database, storage bucket, load balancers, and so on.
Diagrams can be generated automatically in CI/CD pipelines or documentation builds using code.
Prerequisites and Installation
In this tutorial, you'll learn how to draw diagrams using the Python Diagrams library. The basic prerequisites are:
Python 3.7+
pip for installing Python packages
Graphviz installed on your operating system for rendering output images
The Python package:
pip install diagramsA terminal to run files like:
python diagram.py
What is Diagrams?
Diagrams is a Python library that lets you draw cloud system architecture in Python code. It supports different providers like Azure, GCP, AWS, and so on.
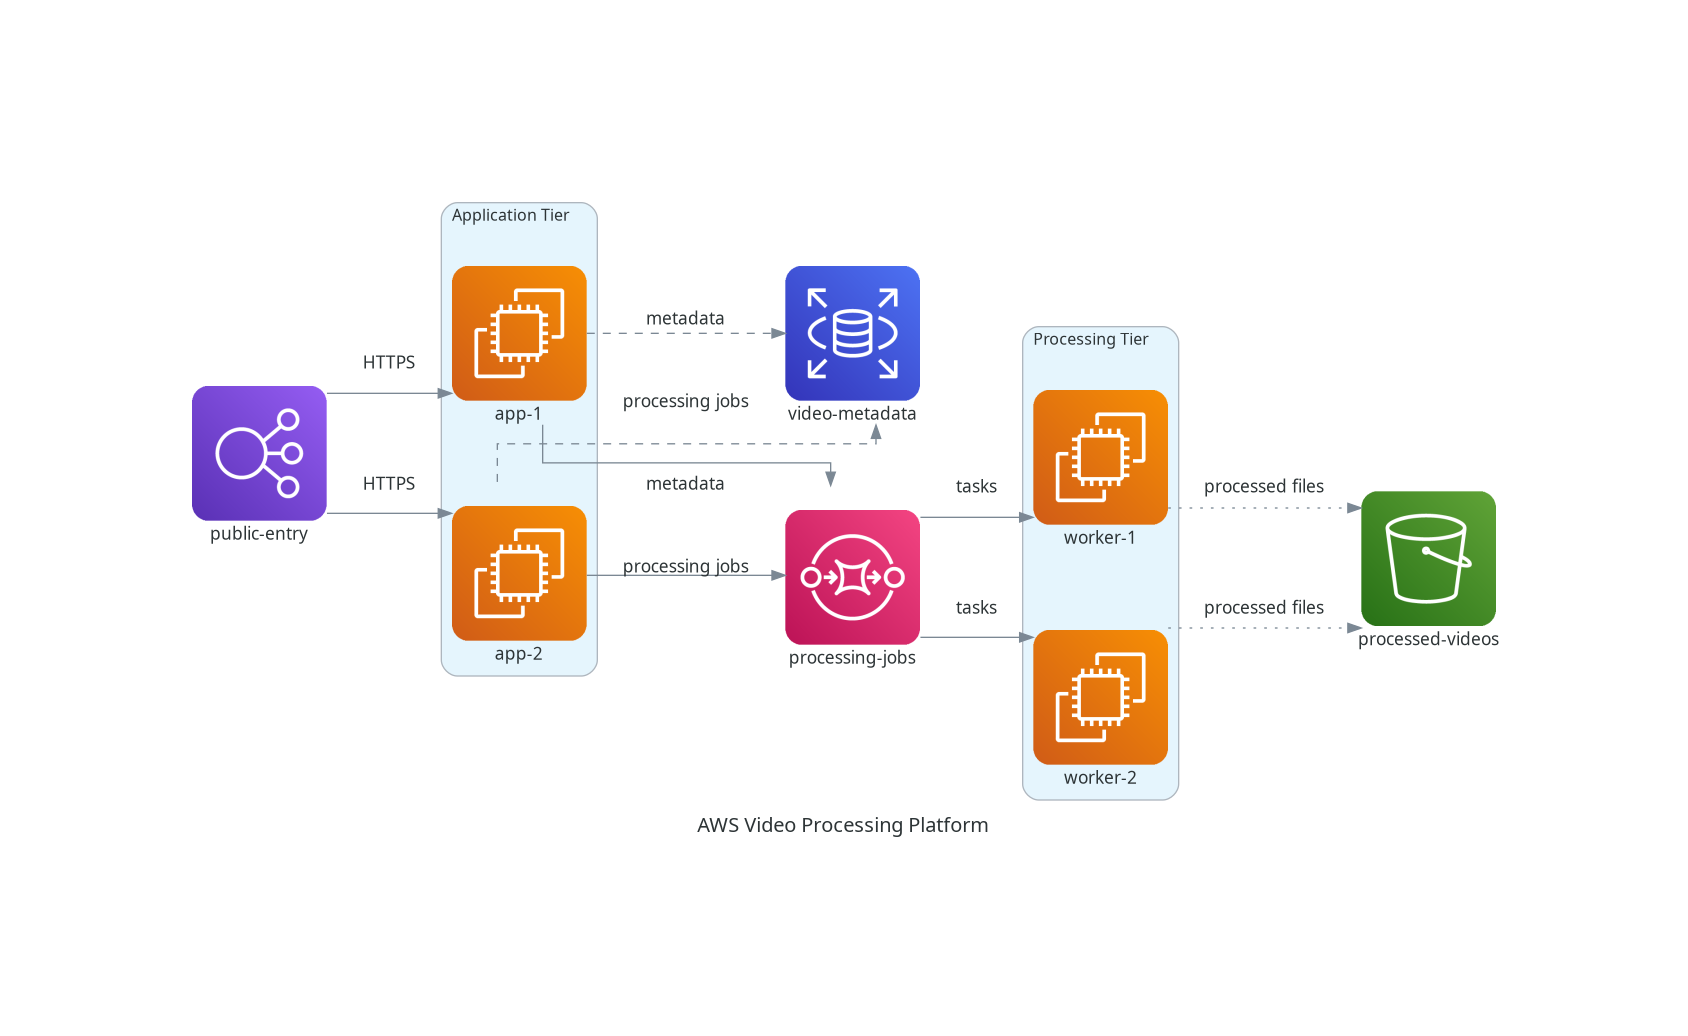
By the end of this tutorial, you'll be able to understand how this diagram was made:
Your First Diagram
First, make sure your setup is complete as per the prerequisites. Then create a Python file with the .py extension and add this code to it:
from diagrams import Diagram
from diagrams.aws.compute import EC2

with Diagram("Practice Architecture"):
    EC2("api-server")
Let's understand the program line by line.
First, we have import Diagram:
from diagrams import Diagram
Think of Diagram as a blank canvas and everything you draw goes inside it. Diagram represents a global diagram context.
Then we import a node type. A node represents one component in your architecture. For example, ECS, lambda, Service, and firewall are resource types.
from diagrams.aws.compute import EC2
A node object consists of three parts: provider, resource type, and name. In the example above, the EC2 is a node of resource type compute which is provided by the aws provider.
This imports the EC2 node from the AWS compute group. We'll use this class to create EC2 nodes.
diagrams.aws.compute is the import path and it tells you where the EC2 icon is located.
diagrams
└── aws
    └── compute
        └── EC2
You can explore more official node types for different providers here.
Let's say you want to use the Analytics component from AWS in your diagram. First, you'll search for Analytics from the list of node types shared above. Your import statement will look like this: from diagrams.aws.analytics import Analytics.
Then create the diagram context using with Diagram:
with Diagram("Practice Architecture"):
Coming back to your example, this creates a diagram named Practice Architecture. Everything indented underneath with Diagram belongs to that diagram.
Now create a node:
EC2("api-server")
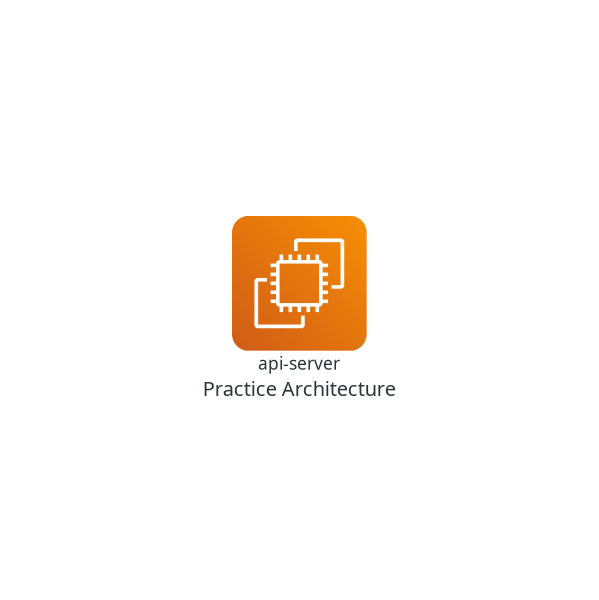
This creates one EC2 node with the label displayed as api-server underneath it.
And finally, run the code. If you saved your Python code file as test.py, run it using python test.py. Diagrams generates an image file for you in the current folder:
In short, this is what the process looks like:

Note that you're describing infrastructure instead of manually drawing it. You aren't thinking about drawing and arranging icons. Instead, you just code EC2("api-server") and Diagrams decides how to render it.
We can slightly expand the above example to include two EC2 instances:
from diagrams import Diagram
from diagrams.aws.compute import EC2

with Diagram("Practice Architecture"):
    EC2("api-server")
    EC2("worker")
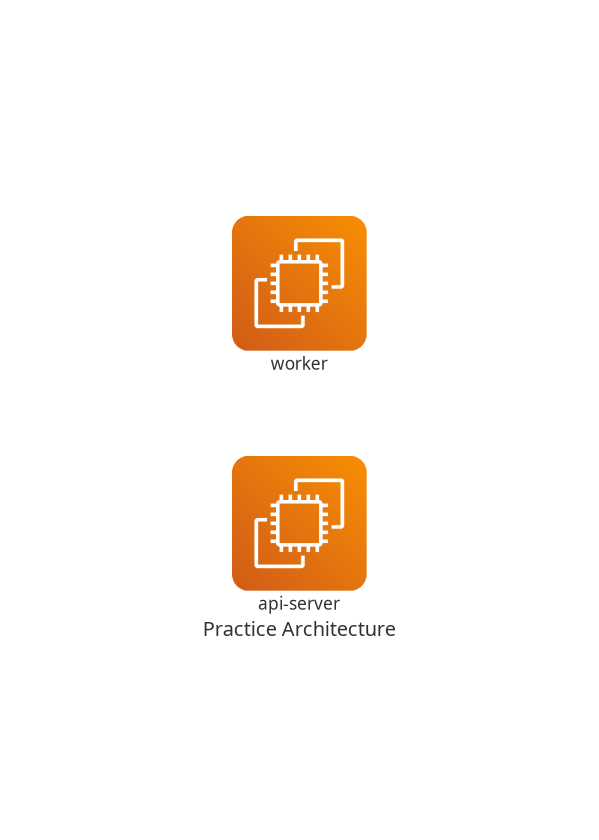
Note that you can assign your node instances to variables. In this way, it's easy to reference them.
The example below demonstrates variable assignment:
from diagrams import Diagram
from diagrams.aws.compute import EC2

with Diagram("Practice Architecture"):
    api_server = EC2("api-server")
    worker = EC2("worker")
How to Connect Nodes and Data Flow
You've learned how to create nodes. Now you'll see how to connect them.
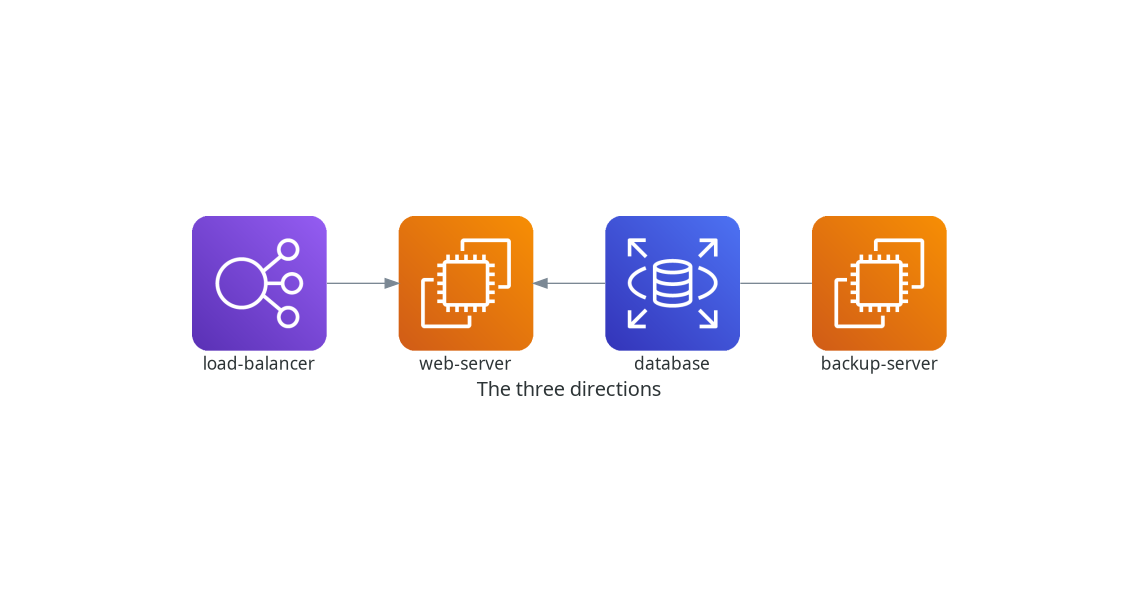
Directions are represented by the following symbols:
>>for left-to-right flow<<for the opposite direction (right-to-left)-for an undirected connection
Let's see an example of these together:
from diagrams import Diagram
from diagrams.aws.compute import EC2
from diagrams.aws.database import RDS
from diagrams.aws.network import ELB

with Diagram("The three directions"):
    load_balancer = ELB("load-balancer")
    web_server = EC2("web-server")
    database = RDS("database")
    backup_server = EC2("backup-server")

    load_balancer >> web_server
    web_server << database
    database - backup_server
Pay attention to connections between nodes:
# Connects load balancer to web server with a left to right arrow
load_balancer >> web_server

# Connects web server and database using a right to left arrow
web_server << database

# connects database and web server using a straight line
database - backup_server
Grouping Data Flows
You can also connect one node to multiple nodes using a Python list. This way you don't need to connect individual nodes one by one to another node.
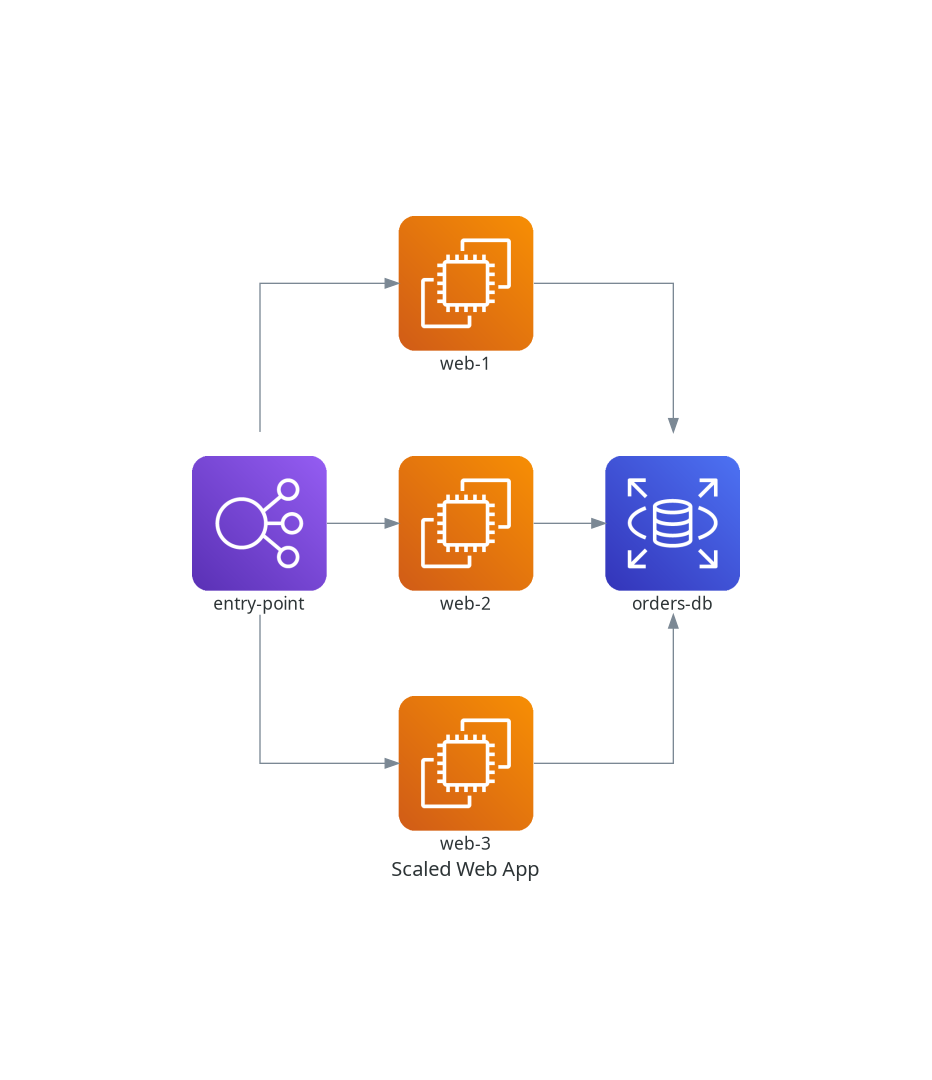
Let's say you want to implement this architecture:
                    ┌──► web-1 ───┐
load-balancer ──────┼──► web-2 ───┼──► database
                    └──► web-3 ───┘
First, create a load balancer:
load_balancer = ELB("entry-point")
Then create several servers. Instead of creating three separate variables like this:
server1 = EC2("web-1")
server2 = EC2("web-2")
server3 = EC2("web-3")
You can put them inside a Python list:
web_servers = [
    EC2("web-1"),
    EC2("web-2"),
    EC2("web-3")
]
Then connect LB node to the listload_balancer >> web_servers like this:
load_balancer >> web_servers
This way, you don't need to manually write:
load_balancer >> web_servers[0]
load_balancer >> web_servers[1]
load_balancer >> web_servers[2]
Now, connect the whole list to the database:
web_servers >> database
This approach is useful for reducing redundancy in code. It helps in targeting repeated components like multiple pods, workers, and so on.
The complete code looks like this:
from diagrams import Diagram
from diagrams.aws.compute import EC2
from diagrams.aws.database import RDS
from diagrams.aws.network import ELB

with Diagram("Scaled Web App"):
    load_balancer = ELB("entry-point")

    web_servers = [
        EC2("web-1"),
        EC2("web-2"),
        EC2("web-3")
    ]

    database = RDS("orders-db")

    load_balancer >> web_servers >> database
Clusters
You can group related nodes inside a labeled box using clusters. You can still connect nodes inside a cluster to outside nodes.
Grouping is necessary to demonstrate what belongs together. It helps represent concepts such as:
application tiers
database tiers
availability zones
regions
environments
microservice groups
worker groups
This is the syntax to create a cluster:
with Cluster("Cluster name"):
Anything indented under this will be part of the cluster.
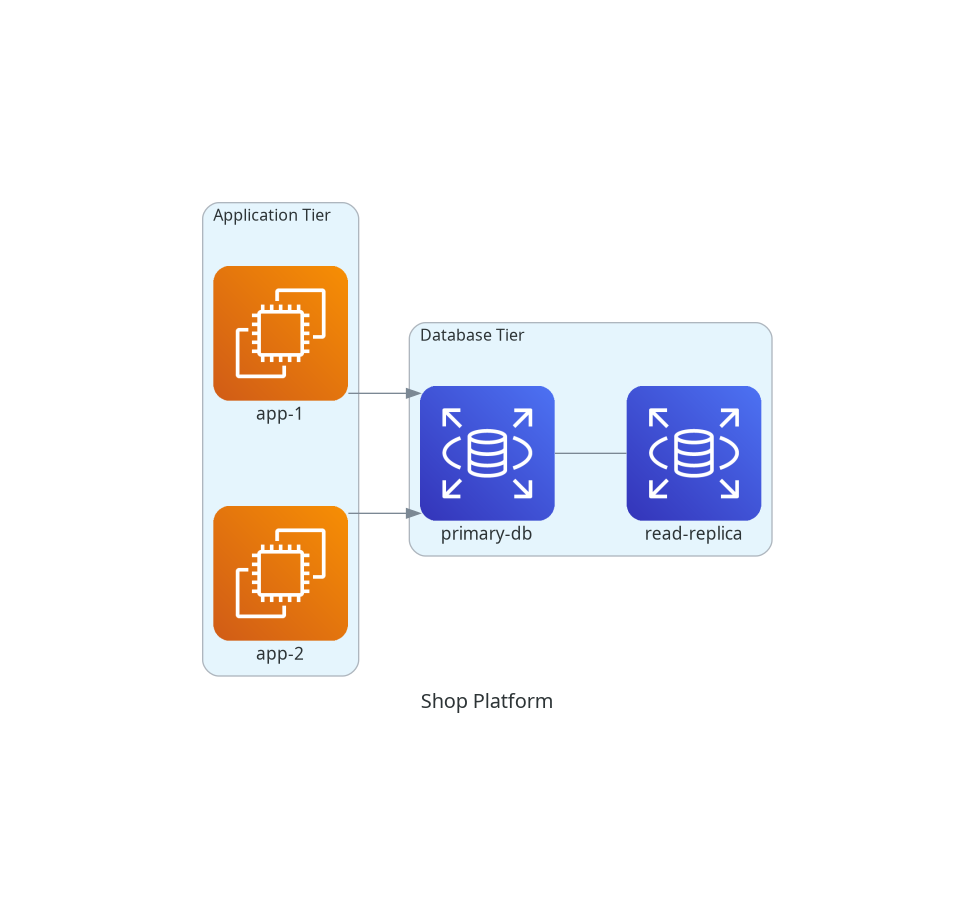
Here's an example to demonstrate clusters:
from diagrams import Diagram, Cluster
from diagrams.aws.compute import EC2
from diagrams.aws.database import RDS

with Diagram("Shop Platform"):
    with Cluster("Application Tier"):
        apps = [
            EC2("app-1"),
            EC2("app-2")
        ]

    with Cluster("Database Tier"):
        primary_db = RDS("primary-db")
        replica_db = RDS("read-replica")

    apps >> primary_db
    primary_db - replica_db
It's also possible to nest clusters using this syntax:
with Cluster("Production"):

    with Cluster("Backend"):

        with Cluster("API"):
            ...
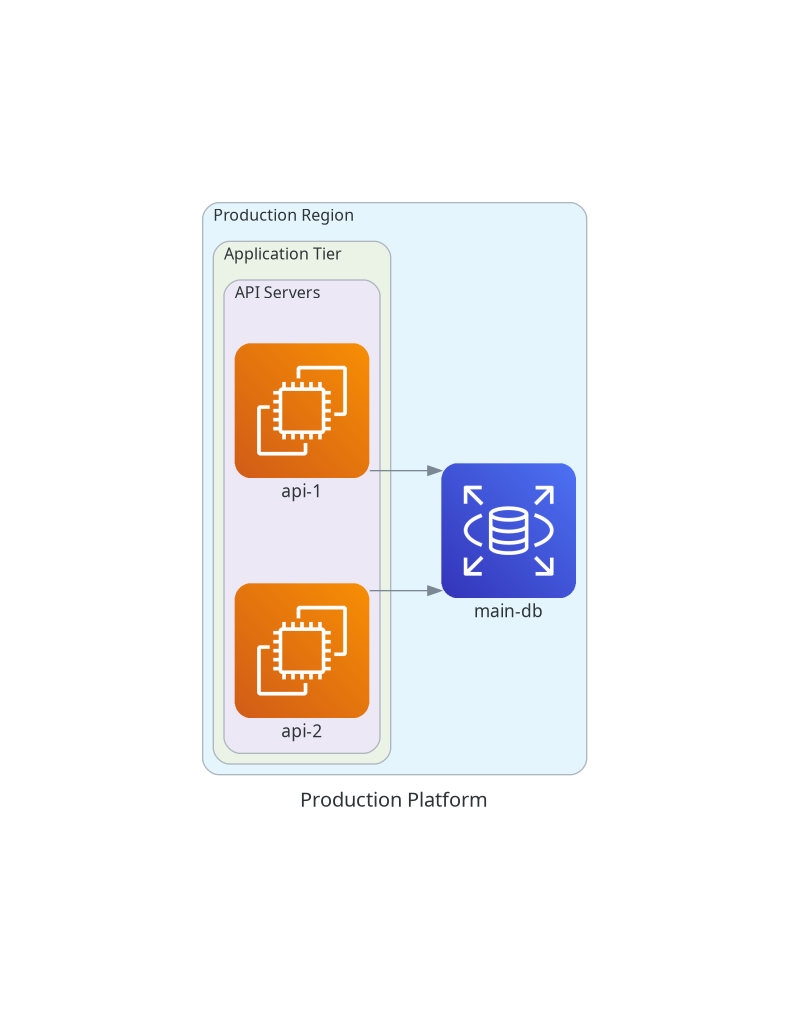
Let's look into a more realistic example that nests clusters:
from diagrams import Diagram, Cluster
from diagrams.aws.compute import EC2
from diagrams.aws.database import RDS

with Diagram("Production Platform"):

    with Cluster("Production Region"):

        with Cluster("Application Tier"):

            with Cluster("API Servers"):
                api1 = EC2("api-1")
                api2 = EC2("api-2")

        database = RDS("main-db")

        api1 >> database
        api2 >> database
The example demonstrates a Production Platform that contains a Production Region, which contains an Application Tier. The Application Tier which further groups two API servers. A separate RDS database sits inside the production region, and both API servers connect to it.
Indenting the clusters beneath each other enables nesting of clusters. Refer to the code snippet below:
with Cluster("Production Region"):

        with Cluster("Application Tier"):

            with Cluster("API Servers"):
                api1 = EC2("api-1")
                api2 = EC2("api-2")
Edges
Edges provide another way to connect nodes. Unlike plain >> or <<, edges let you add properties such as label, color and style.
Previously you used:
from diagrams import Diagram
To use an edge, add:
from diagrams import Diagram, Edge
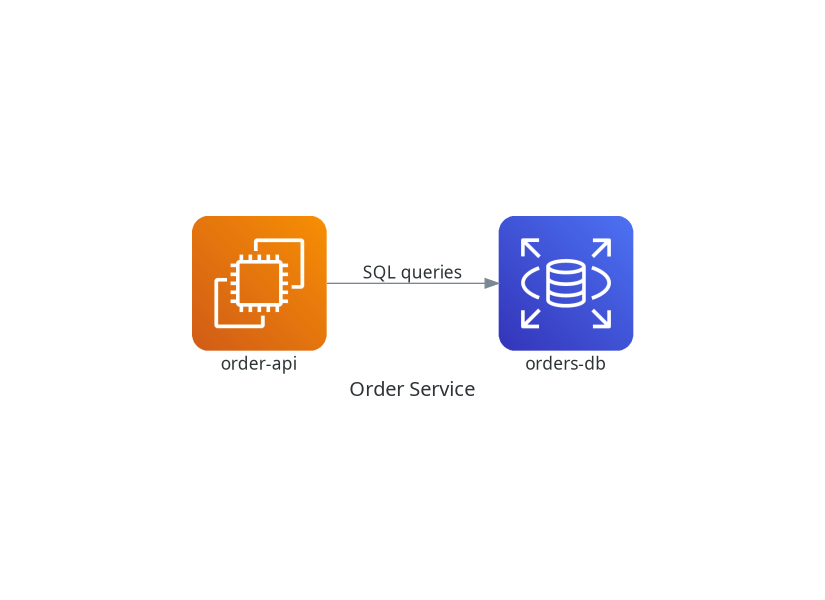
Now connect app to database using an edge:
# Labeling an edge
app >> Edge(label="SQL queries") >> database
This connects app to database using an edge labeled "SQL queries".
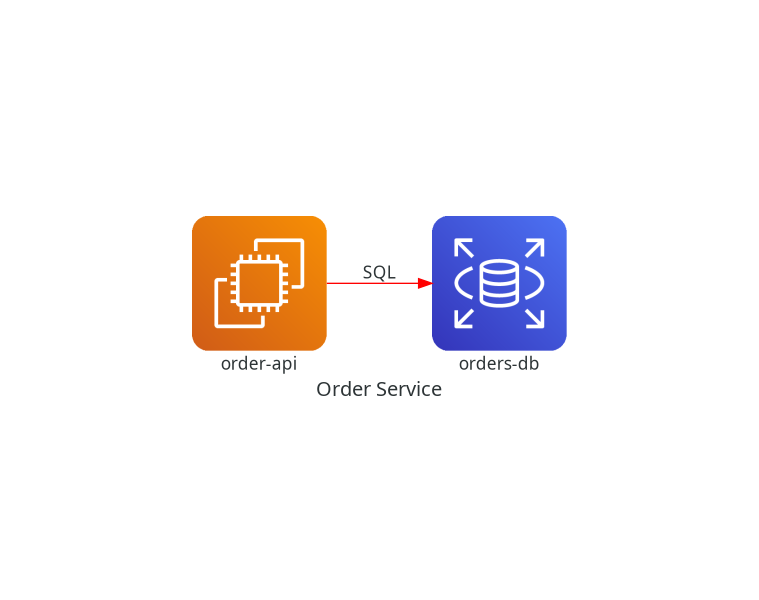
You can also customize edge color:
app >> Edge(label="SQL", color="red") >> database
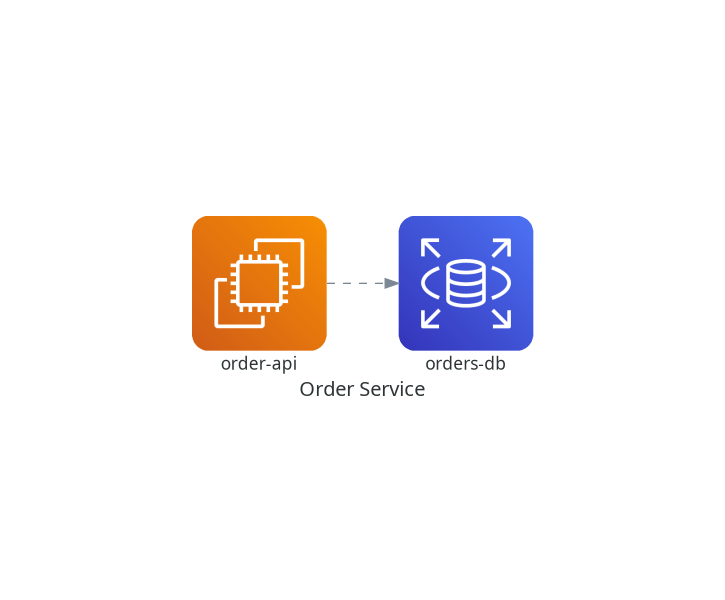
You can also modify the line style:
app >> Edge(style="dashed") >> database
These are some other available edge styles:
Edge(style="dotted")
Edge(style="bold")
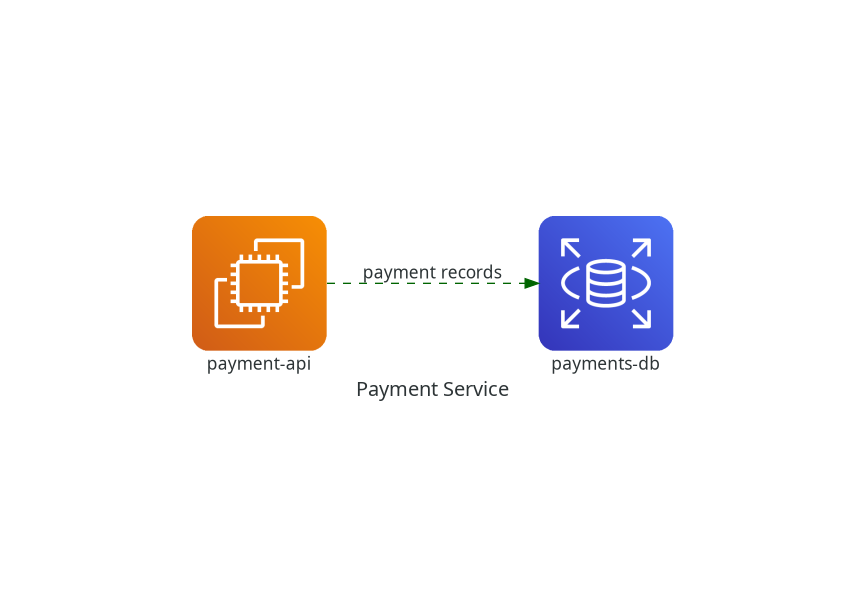
The example below combines multiple edge styles:
from diagrams import Diagram, Edge
from diagrams.aws.compute import EC2
from diagrams.aws.database import RDS

with Diagram("Payment Service"):
    api = EC2("payment-api")
    database = RDS("payments-db")

    api >> Edge(
        label="payment records",
        color="darkgreen",
        style="dashed"
    ) >> database
Note that you can also use edge with << and -.
Conclusion
In this tutorial, you learned how to create meaningful, consistent diagrams that scale well across teams using the diagram-as-code approach. This allows you to be efficient without compromising on quality and other development or maintenance tasks.
In this tutorial you mostly used AWS components. You can explore other available providers in this guide and create diagrams as per your requirements.
Thank you for reading the article until the end. If gained something from the article, consider sharing it with others.
Stay Connected and Continue Your Learning Journey!
Connect with me on:
LinkedIn: I share content related to Linux, Cyber security and DevOps. If you found the article helpful, please leave a recommendation on LinkedIn.
X: I share pre-launch updates and some behind the scenes.
Happy coding!


