
By Shruti Tanwar
Lately, I’ve had the chance to be involved in building a product that aims at accelerating ML/AI (Machine Learning / Artificial Intelligence) adoption for businesses. In the process of developing such an exciting product, I learned a thing or two along the way.
And although ML/AI is too big of an umbrella to be covered in a single article, I’m taking this chance to brighten the light on one of the concepts which will help you in building out a resilient predictive model. A model which is capable of performing reliably in the real-world, and behaves ‘fairly’ on unseen data.
You can never be a 100% sure about your machine learning model’s behavior. There is always room for improvement, or progress or a certain tweak ?. Merely fitting the model to your training data and expecting it to perform accurately in the real world, would be a poor choice to make. Certain factors that can guarantee or at least assure you of reasonable performance need to be considered before deploying the model to production.
You need to make sure that your model has an understanding of different patterns in your data — is not under-fit or over-fit — and the bias and variance for the model are on the lower end.
“Cross-Validation” ✔ is the technique which helps you validate your model’s performance. It’s a statistical method used to estimate the skill of machine learning models. Here's a definition for you:
Cross-validation, sometimes called rotation estimation, or out-of-sample testing is any of various similar model validation techniques for assessing how the results of a statistical analysis will generalize to an independent data set. It is mainly used in settings where the goal is prediction, and one wants to estimate how accurately a predictive model will perform in practice.
In extremely simple words, the practical implementation of the above jargon would be as follows:
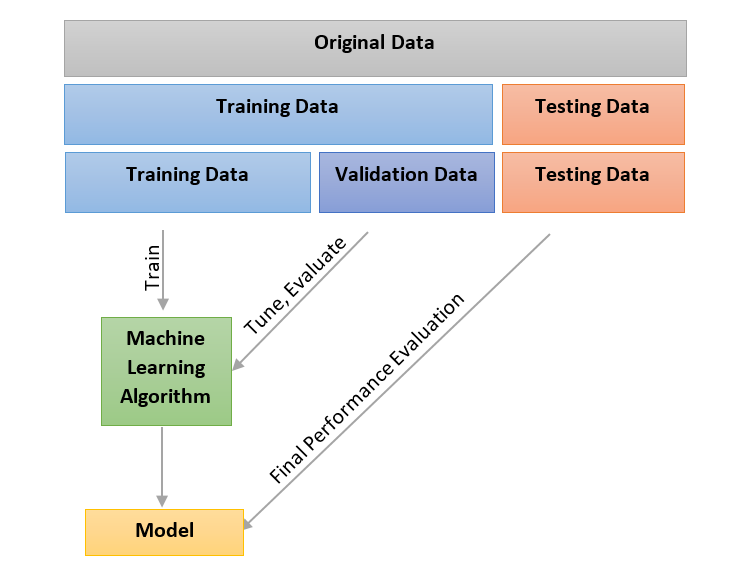
While training a model, some of the data is removed before training begins.
Upon completion of training, the data that was removed is used to test the performance of the learned model and tweak the parameters to improve the final performance of the model.
This is the fundamental idea for the whole spectrum of evaluation methods called cross-validation.
Before discussing the validation techniques though, let us take a quick look at two terms used above. Over-fit and under-fit. What exactly is under-fitting and over-fitting of models and how does it affect the performance of a model with real-world data?
We can understand it easily through the following graph.
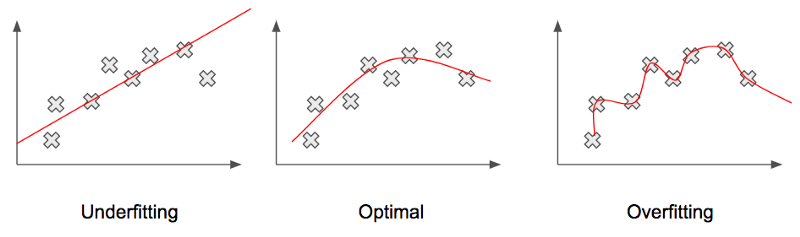
A model is said to be underfitting (High Bias) when it performs poorly on the training data. As we can see in the graph on the left, the line doesn’t cover most of the data points on the graph meaning it has been unable to capture the relationship between the input (say X), and the output to be predicted (say Y).
An overfitting model, (High Variance) on the other hand, performs well on the training data but does not perform well on the evaluation data. In such a case, the model is memorizing the data it has seen instead of learning and is unable to generalize to unseen data.
The graph on the right represents the case of over-fitting. We see that the predicted line is covering all the data points in the graph. Though it might seem like this should make the model work even better, sadly, that’s far from the practical truth. The predicted line covering all points which also includes noise and outliers produces poor results due to its complexity.
Let’s move on to the various types of cross-validation techniques out there.
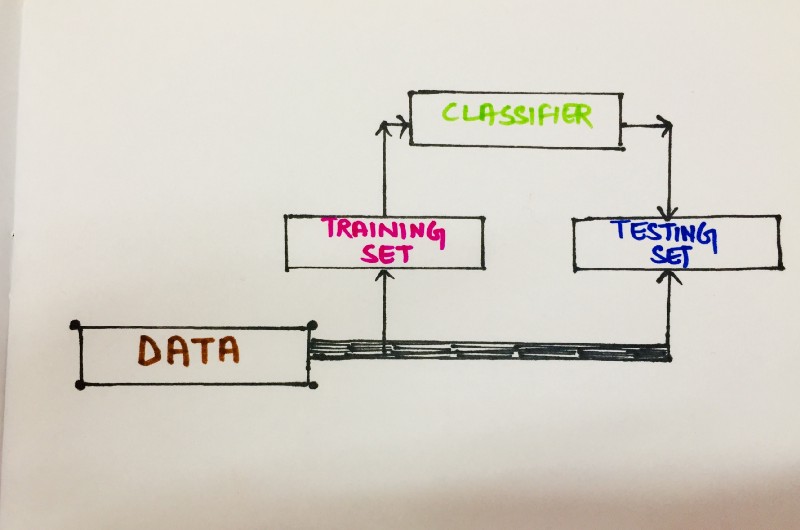
Holdout Method
The simplest type of cross-validation. Here, the data set is separated into two sets, called the training set and the testing set. The model is allowed to fit only on the training set. Then the predictions are made for the data in the testing set (which the model has never seen before). The errors it makes are aggregated to give the mean absolute test set error, which is used to evaluate the model.
This type of evaluation to an extent is dependent on which data points end up in the training set and which end up in the test set, and thus might affect the evaluation depending on how the division is made.
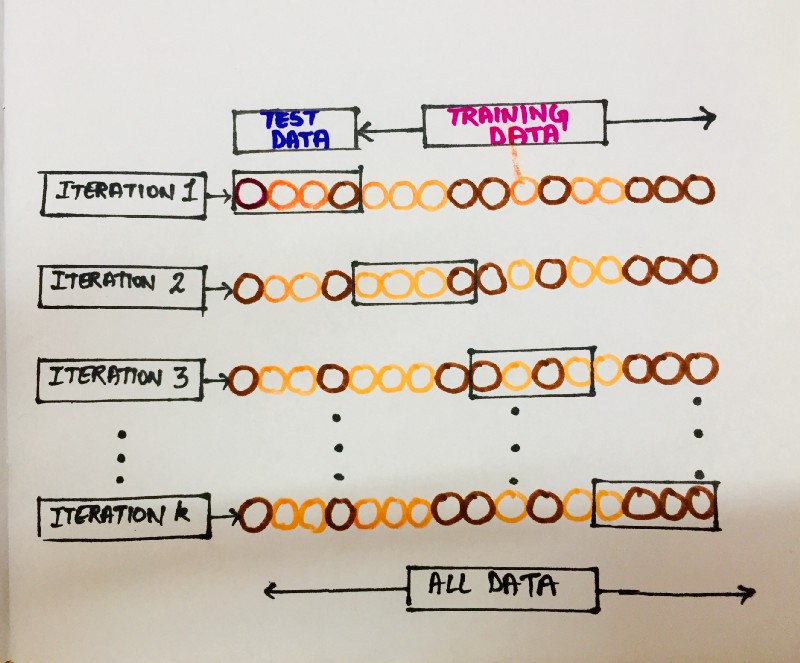
K-fold cross-validation
One of the most popular validation techniques is the K-fold cross-validation. This is due to its simplicity which generally produces less biased or less optimistic estimate of the model skill than other methods, such as a simple train/test split.
Here, the data set is divided into k subsets, and the holdout method is repeated k times. Each time, one of the k subsets is used as the test set and the other k-1 subsets constitute the training set. Then the average error is computed across all k trials.
The general procedure is as follows:
- Shuffle the dataset randomly and split it into
kgroups - Take one group as a holdout or test data set and the remaining groups as training data set.
- Fit a model on the training set and evaluate it on the test set.
- Retain the evaluation score and discard the model.
- Summarize the skill of the model using the sample of model evaluation scores.
The edge this method has over others is that it matters little how the data gets divided. Every data point will get to be in a test set exactly once and will get into training set exactly k-1 times. As k is increased, we see a fall in the variance of the resulting estimate.
One disadvantage of this method can be the computation required during the training. The training algorithm has to be rerun from scratch k times, which means it takes k times as much computation to make an evaluation.
Leave-one-out cross-validation
Leave-one-out is sort of like a cousin to K-fold cross-validation where k becomes equal to n, the total number of data points in the set. It's basically a logical extreme version of K-fold validation. How it works practically is by leaving out exactly one data point in each iteration and using that data point to make the prediction.
The function approximator is trained on all the data, exactly n times, except for one point and a prediction is made for that point. As before, the average error is computed and used to evaluate the model.
There we go and call it a wrap. Hope you enjoyed reading it as much I enjoyed creating it.❤️ Let me know your thoughts?, comments? or advice? in the comments below.
And while you’re at it, why don’t you go and check out what I build with my team, at skyl.ai, and strike up a conversation with me or share your feedback. Cheers.