
By Chris Cooney
And the crazy stuff you can do once it is.

The moment you get Istio working on your cluster, it feels like you’ve taken quite a serious leap forward. The level of monitoring, security, and functionality you immediately gain are light years ahead of the competition. A few months ago, we took the plunge and installed Istio onto our Kubernetes cluster and… hot damn. We’ll begin at the beginning, with installation and the pitfalls we found, then an overview of the tools we’ve found most useful.
Getting the motor running.
The easiest and most efficient way to install Istio is using the Helm chart. You get a production ready installation out of the box. You have a few options but Istio provides a convenient download command so you can pull down a versioned bundle of the Istio Helm chart. The following will get you version 1.0.6 of the Istio package.
curl -L https://git.io/getLatestIstio | ISTIO_VERSION=1.0.6 sh -
Within this downloaded bundle, is a convenient little helm chart. It is located in install/kubernetes/helm/istio. Once you’re in this directory, it’s a simple helm installation. We prefer to use helm upgrade — install rather than a straight up install so that the same command can be automated:
helm upgrade istio . -f values.yaml \--namespace istio-system \--install
This will use the default values.yaml file that is provided in the folder. You can alter this file to switch on or off different features.
A note on uninstalling Istio
Common sense would dictate that a helm delete --purge istio would remove all of the Istio resources, but it doesn’t remove the CustomResourceDefinition types. We had to dig around and delete the CRDs manually. We ended up scripting this. Just something to keep in mind.
Once it was installed, we configured some endpoints and started reviewing what our new cluster could do. Oh boy, we were not disappointed.
Configuring Istio
The last thing to do is to annotate a namespace to indicate that Istio can perform automatic sidecar injection. This is the simplest way to use Istio. The annotation is simple. An example namespace yaml you could use is the following:
apiVersion: v1kind: Namespacemetadata: name: my-namespacelabels: istio-injection: enabled
Any applications that are deployed into this namespace will get an envoy proxy. This proxy will analyze your network traffic and publish to the Istio Prometheus server, where downstream systems can make use of it.
How do I know if I have an Envoy Proxy?
Simple, run kubectl get pods within your desired namespace. You’ll see something like this:
my-application-pod 2/2 Running 0 2d
Assuming you’re only deploying one container per pod, a second container will now appear. This second container is your envoy proxy. If it’s there and it’s ready, you’re good to go.
Kiali
I’m coming right out of the gate with my favorite. Kiali provides live network diagramming and HTTP statistics for your applications. It’s a real crowd pleaser and it gives you an excellent “at a glance” dashboard.
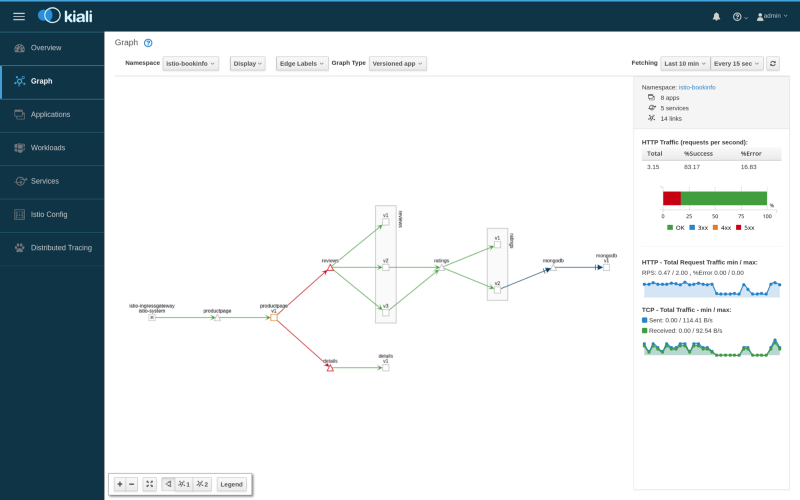
Look at the right-hand side of that image. On top of the high level of visibility, you get detail. You could stick the network overview on a TV screen. When one of those lines go red, you can dig into the HTTP details under the hood.
Quirks of Kiali
You might see traffic coming from “unknown” in kiali, like this:
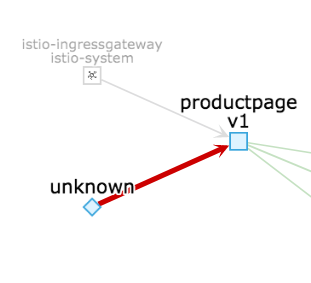
This is actually the Kubernetes health check. It’s nothing to be concerned about. You can hide this by doing one of a few things:
- Adjust your healthcheck to use a local exec on the docker container, rather than an HTTP based check. This is a bit hacky.
- Use a different port than your main application port for your health check. This is the direction we’ve gone with, which also opens another door for (more on this later)
Istio is working on this and there is a fix in the brand new v1.1 release.
Grafana
Istio will populate a Grafana instance immediately for you. This Grafana instance is absolutely packed with useful application metrics, driven by the data published out of each application’s envoy proxy.
As soon as you deploy a new application with an envoy proxy, you get metrics that typically takes teams weeks to put together:
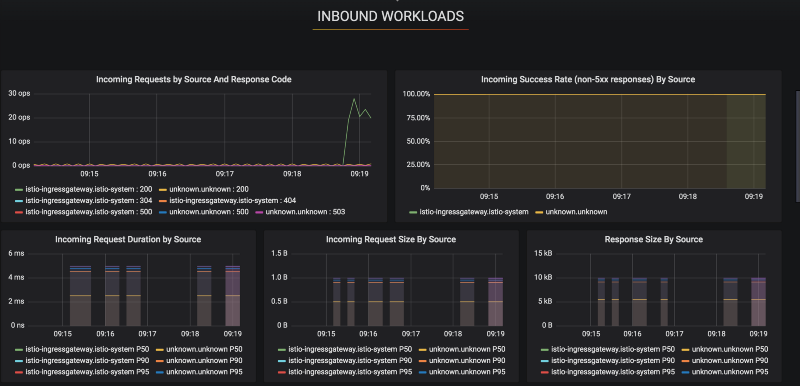
It’s important to recognize, I didn’t configure any of this. Istio is involved enough in your system to pull all of this out for you. And to top it off, this is one of many dashboards. There are tons of them, more than I think I’ll ever use. In the case of monitoring, more is more. I’d rather have too much detail and tone it down, than no visibility at all.
Prometheus
This is the engine behind everything that’s going on. Prometheus is scraping and aggregating vast sums of data and presenting it in a convenient way. I haven’t had to spend a huge amount of time playing with it, to tell you the truth. The Istio services provide some incredibly useful, out of the box functionality. Prometheus can be used to write your own graphs or scrape custom metrics from your applications.
Off of the back of this data, you can trigger alerts using Alert Manager, creating highly sophisticated monitoring and alerting platform for your applications.
The control you gain
On top of all of this, Istio has some baked in utilities that really pushes the limit. You’ll be able to trigger faults, cause outages, blackhole traffic and much more. I’ve detailed a few of the cool features that I’ve had a chance to play with, but there are far more.
Fault Injection
With Istio, you can inject failures. For example, the following YAML will cause 100% of requests to return an HTTP status code of 500. Useful for when you’re simulating a third party outage.
apiVersion: networking.istio.io/v1alpha3 kind: VirtualService metadata: name: ratings spec: hosts: - ratings http: - fault: abort: httpStatus: 500 percent: 100 match: - headers: end-user: exact: json route: - destination: host: ratings subset: v
The documentation is pretty good and you can dive into all sorts of this functionality. What I’m doing here is simply showing you the surface.
Resilience policies as standard
How often have you written logic to implement retries? Front-loading all of this in a product makes it difficult to focus on the specific business value. Istio makes this simpler. For example, by baking retries in:
apiVersion: networking.istio.io/v1alpha3kind: VirtualService metadata: name: ratings spec: hosts: — ratings http: — route: — destination: host: ratings subset: v1 retries: attempts: 3 perTryTimeout: 2s
This will ensure that requests made by your service are retried three times, with a timeout of two seconds in each. No more pollution of your application code — load that into the service mesh and keep your services simple.
Mutual TLS
Service to service encryption can be tough. Ensuring certificates don’t expire is a serious operation… but not with Istio. Istio uses the certificate manager pod to ensure that your applications have their very own, shiny certificate.
Then, with the correct DestinationRule, you can mandate that your applications will only allow TLS encrypted traffic. This ensures that all inter-cluster communication is locked down. The application doesn’t have a clue. It issues the request in HTTP and the Envoy proxy sidecar will transparently upgrade it to Mutual TLS. The following destination rule will ensure that all requests to v1 of the productpage service must be encrypted using mutual TLS.
apiVersion: networking.istio.io/v1alpha3kind: DestinationRulemetadata: name: productpagespec: host: productpage trafficPolicy: tls: mode: ISTIO_MUTUAL subsets: - name: v1 labels: version: v1
There’s no such thing as a free lunch
As with everything, there are some dangers and tradeoffs. Istio is brilliant, I’m thoroughly impressed. It’s easy to go off the rails and find yourself with a service mash, rather than a service mesh.
Messy integration layers
Anyone who has worked in a sufficiently large organization will have seen this. “Integration layers” that are originally designed to link two applications together. Then they get a little extra logic, a few files here and there, some routing rules sprinkled over the top and all of a sudden, they’re a nest of complexity.
Be careful with Istio in this regard. It is tremendously powerful but requires careful thought. Some features are cool but you might not actually need them. And sometimes, dare I say it, a little repetition in microservices is more desirable than a service mesh with more logic in it than your actual applications.
Complexity
Kubernetes offers a lot to learn. The learning curve is quite kind, especially when compared to the alternatives, but the domain is broad. When you introduce Istio, you also introduce a series of new, more complex concepts. VirtualService and Gateway types of Custom Resource Definitions that you will need to become comfortable with.
This is a trade-off. Look at your cluster or your team and decide. Is our monitoring doing the job perfectly? Are our applications resilient? Do the engineers complain about the repetition of logic? Make sure you’re getting something in return for this complexity and this trade is a no-brainer. Just don’t sleepwalk into a nightmare.
It’s changing… fast
Istio has recently announced that it is production ready and with its 1.1 release, addressed a lot of the existing concerns. That said, this is a new product. If you’re the type of organization that struggles to keep up, the pace that Istio is moving at might be a detriment to you. Falling behind might be catastrophic, especially if security vulnerabilities and bugs turn up.
Once again, this is a burden you need to reason about. Do you have the capability to keep up? If not, could you? And even if you could, is it worth it? Do you really need this extra operational overhead?
That’s all folks
I’ve given the highlights of my experience with Istio. I’ve personally used all the functionality in this article and it has been outstanding. We’ve seen the odd quirk or two but nothing that has given us much pause for thought. All in all, provided you have a situation that needs it, Istio takes your cluster to the next level.
I’m talking about Istio, Kubernetes, and DevOps regularly, on my twitter account.