By Yan Cui
During the execution of a Lambda function, whatever you write to stdout (for example, using console.log in Node.js) will be captured by Lambda and sent to CloudWatch Logs asynchronously in the background. And it does this without adding any overhead to your function execution time.
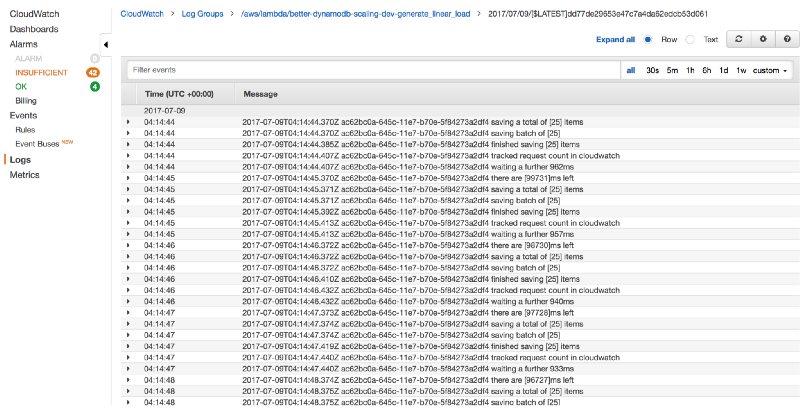
You can find all the logs for your Lambda functions in CloudWatch Logs. There is a unique log group for each function. Each log group then consists of many log streams, one for each concurrently executing instance of the function.
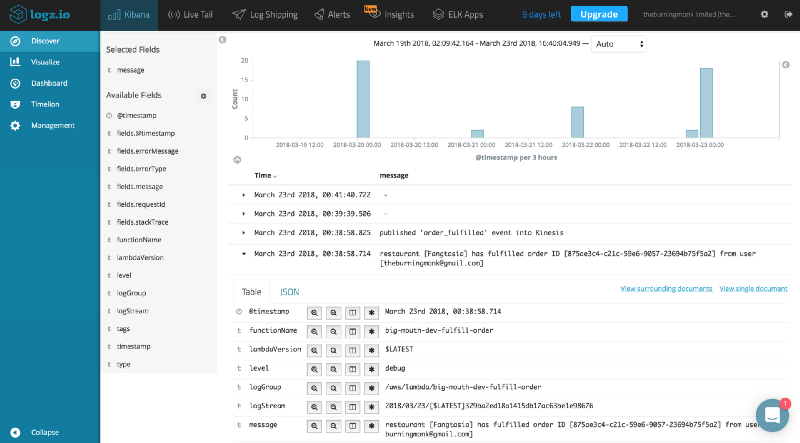
You can send logs to CloudWatch Logs yourself via the PutLogEvents operation. Or you can send them to your preferred log aggregation service such as Splunk or Elasticsearch.
But, remember that everything has to be done during a function’s invocation. If you make additional network calls during the invocation, then you’ll pay for that additional execution time. Your users would also have to wait longer for the API to respond.
These extra network calls might only add 10–20ms per invocation. But you have microservices, and a single user action can involve several API calls. Those 10–20ms per API call can compound and add over 100ms to your user-facing latency, which is enough to reduce sales by 1% according to Amazon.
So, don’t do that!
Instead, process the logs from CloudWatch Logs after the fact.
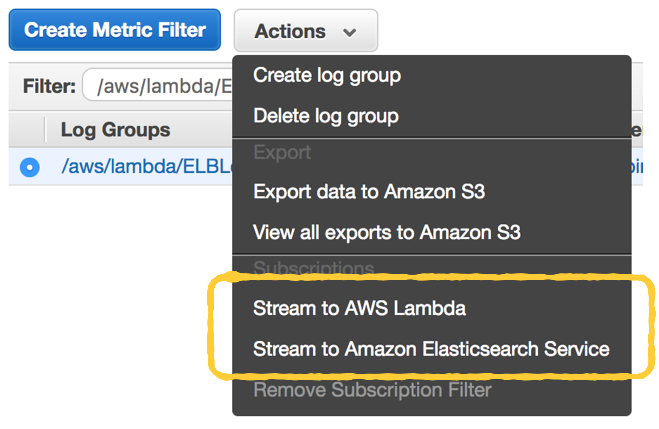
In the CloudWatch Logs console, you can select a log group and choose to stream the data directly to Amazon’s hosted Elasticsearch service.
This is very useful if you’re using the hosted Elasticsearch service already. But if you’re still evaluating your options, then give this post a read before you decide on the AWS-hosted Elasticsearch.
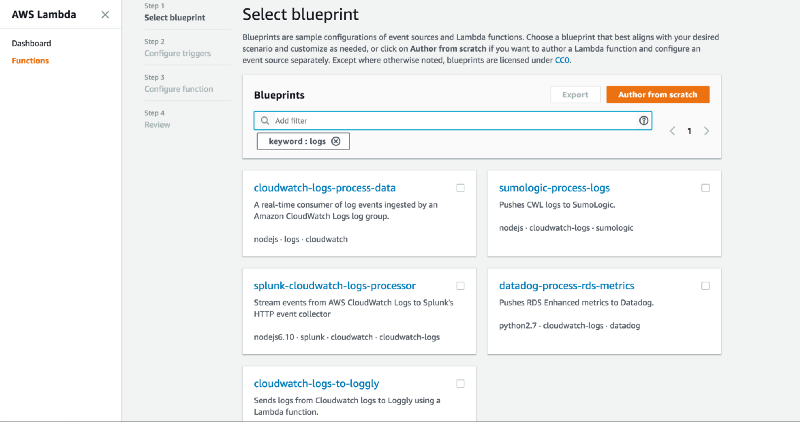
You can also stream the logs to a Lambda function instead. There are even a number of Lambda function blueprints for pushing CloudWatch Logs to other log aggregation services already.
Clearly this is something a lot of AWS’s customers have asked for.
You can use these blueprints to help you write a Lambda function that’ll ship CloudWatch Logs to your preferred log aggregation service. But here are a few more things to keep in mind.
Whenever you create a new Lambda function, it’ll create a new log group in CloudWatch logs. You want to avoid a manual process for subscribing log groups to your log shipping function.
Instead, enable CloudTrail, and then setup an event pattern in CloudWatch Events to invoke another Lambda function whenever a log group is created.
You can do this one-off setup in the CloudWatch console.

If you’re working with multiple AWS accounts, then you should avoid making the setup a manual process. With the Serverless framework, you can setup the event source for this subscribe-log-group function in the serverless.yml.
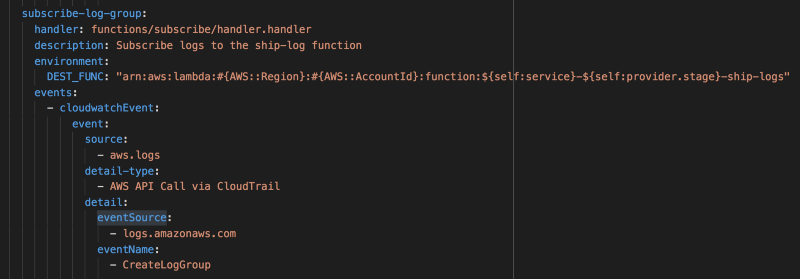
Another thing to keep in mind is that you need to avoid subscribing the log group for the ship-logs function to itself. It’ll create an infinite invocation loop and that’s a painful lesson that you want to avoid.
One more thing.
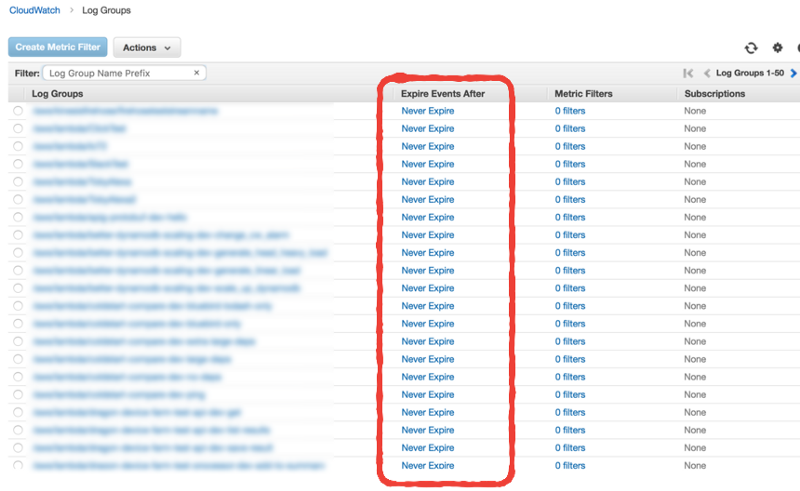
By default, when Lambda creates a new log group for your function, the retention policy is set to Never Expire. This is overkill, as the data storage cost can add up over time. It’s also unnecessary if you’re shipping the logs elsewhere already!
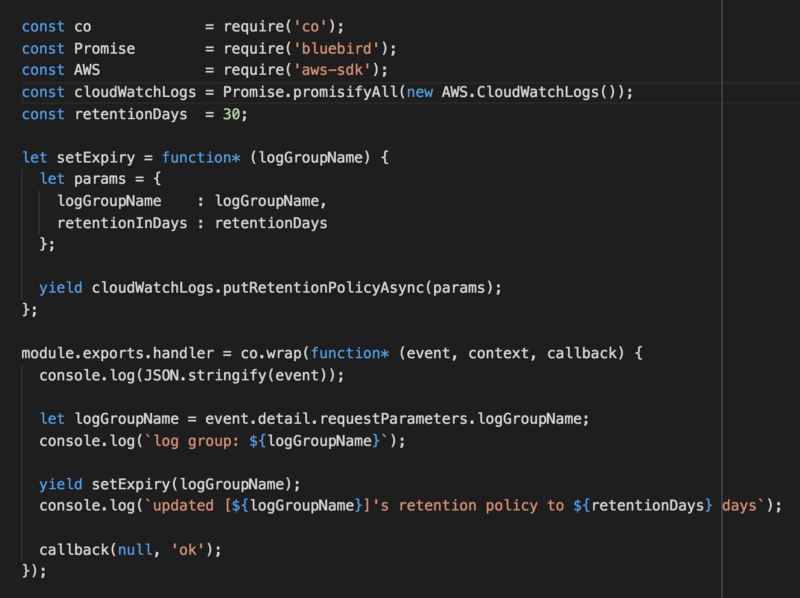
We can apply the same technique above and add another Lambda function to automatically update the retention policy to something more reasonable.
If you already have lots of existing log groups, then consider writing one-off scripts to update them all. You can do this by recursing through all log groups with the DescribeLogGroups API call.
If you’re interested in applying these techniques yourself, I have put together a simple demo project for you. If you follow the instructions in the README and deploy the functions, then all the logs for your Lambda functions would be delivered to Logz.io.