
Charts are a great way of visually displaying large sets of data in formats that are easy to understand and analyze. They are a great way of showing the relationship that exists between two or more data sets.
Different types of charts exist, some of which includes bar chart, line chart, pie chart, radar chart, etc.
In this article, you will make use of a frontend framework called Angular as well as a JavaScript library called Chart.js to display data from a cryptocurrency platform called Coinranking. You will also make use of the Coinranking API to visualize a list of Cryptocurrencies along with their prices.
Prerequisites
To follow along with this tutorial, make sure you are familiar with the basics of the technologies listed below:
HTML
JavaScript
TypeScript
npm
Table of Contents
You can also watch the video version of this article below, or on my YouTube channel:
How to Install and Create the Angular Application
Firstly, you need to install and set up Angular using the following steps:
Step 1: Install NPM (Node Package Manager)
To install npm, you need to download Node.js. This can be done through the Node.js website.
Node.js is an open-source cross platform server environment that can run on Windows, Linux, Unix, macOS, and more. It allows us to make use of npm to install libraries like Chart.js into our Angular application.
Step 2: Install the Angular CLI (Command Line Interface)
Once Node.js is installed, you can now download Angular into your machine with the terminal/command line using the command below:
npm install -g @angular/cli
To confirm Angular has been installed, you can view the version by running the command ng v, which will give us the result below:
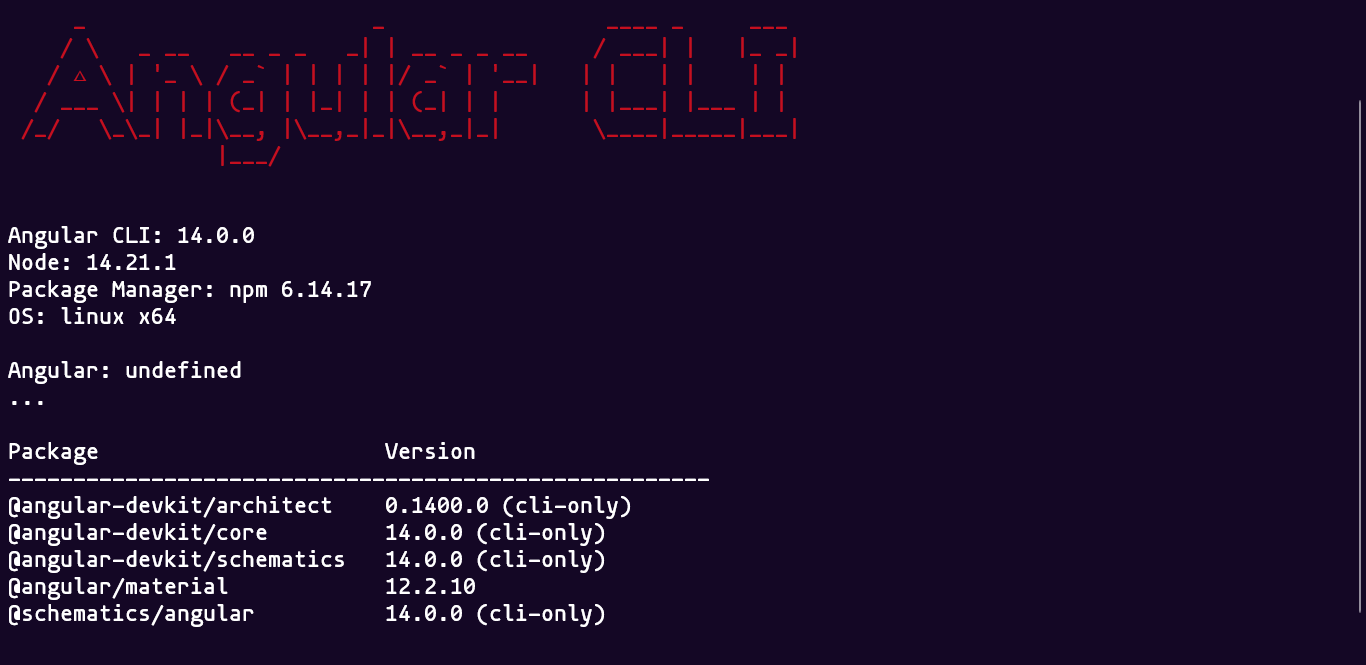
Angular CLI Version
Step 3: Create a New Angular Project
Now that Angular has been installed, you can now create a new project by running the following commands in the terminal:
ng new ng-chart --routing=false --style=css
cd ng-chart
code .
With the commands above, we've created a new Angular project using the ng new command, disabled the routing and set the styling format to CSS.
Next, navigate into the project directory using the cd command, and open the project in Visual Studio Code.
You do not need to generate a new component for this project. You will use the two default files created by the Angular CLI — app.component.ts and app.component.hmtl — to render the chart. These files are in the app directory of your project.
The app.component.html file contains some boilerplate code which you need to get rid of. The Chart.js library can now be integrated into your application.
How to Integrate Chart.js in Angular
To add the chart.js library to the Angular app, you need to run the following command inside your terminal:
npm i chart.js
To confirm chart.js has been installed, you can check the package.json file in your project. You should see the chart.js version in the dependencies object shown in the image below:
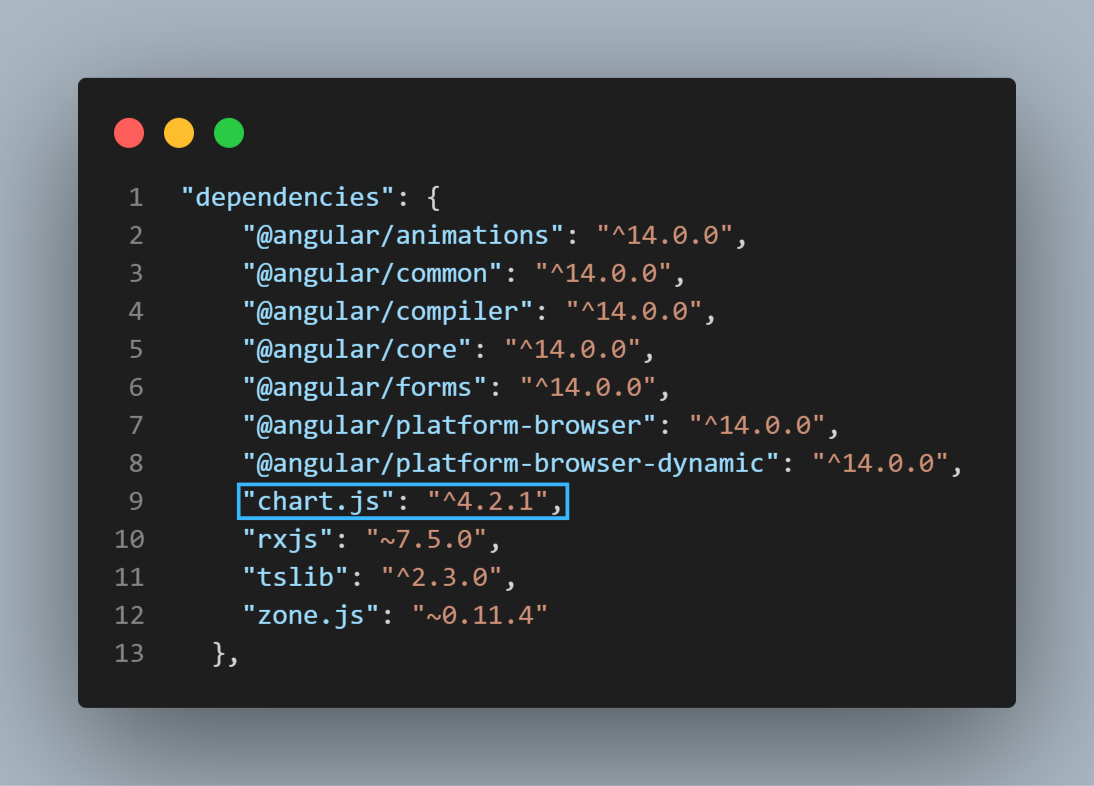
Chart.js version
You can now import the chart.js library inside your project in the app.component.ts file as can be seen below:
import Chart from 'chart.js/auto';
Next, create a variable called chart and set it to an empty array:
chart: any = []
Navigate to the getting started page of the chart.js documentation and grab the boilerplate code with static data, and paste it into the ngOnInit lifecycle hook:
Note: The ngOnInit lifecycle hook in Angular gets triggered once after a component is initialized. That is, it gets called only when the first change detection occurs in an Angular component.
export class AppComponent {
  title = 'ng-chart';
  chart: any = [];

  constructor() {}

  ngOnInit() {
    this.chart = new Chart('canvas', {
      type: 'bar',
      data: {
        labels: ['Red', 'Blue', 'Yellow', 'Green', 'Purple', 'Orange'],
        datasets: [
          {
            label: '# of Votes',
            data: [12, 19, 3, 5, 2, 3],
            borderWidth: 1,
          },
        ],
      },
      options: {
        scales: {
          y: {
            beginAtZero: true,
          },
        },
      },
    });
  }
}
In the code above, within the data object, there is a labels key which contains an array with different values. Beneath that you have the datasets array which contains an object.
Within the object, there is an array called data with values of different numbers. These values represent the data that will get displayed on the chart in the browser.
Before the chart gets displayed in the browser, you'll need to also grab the <canvas></canvas> html tag and paste it in the app.component.html file as seen below:
<div>
  <canvas id="canvas">{{chart}}</canvas>
</div>
Note: In the app.component.html file, the <canvas> tag has an id called canvas. This must have the same name as the value inside the parentheses before the new Chart object in the app.component.ts file. If the names are not the same, the chart will not display.
You can now compile and serve the project by running the ng serve --open command in the terminal. You should have the following results:
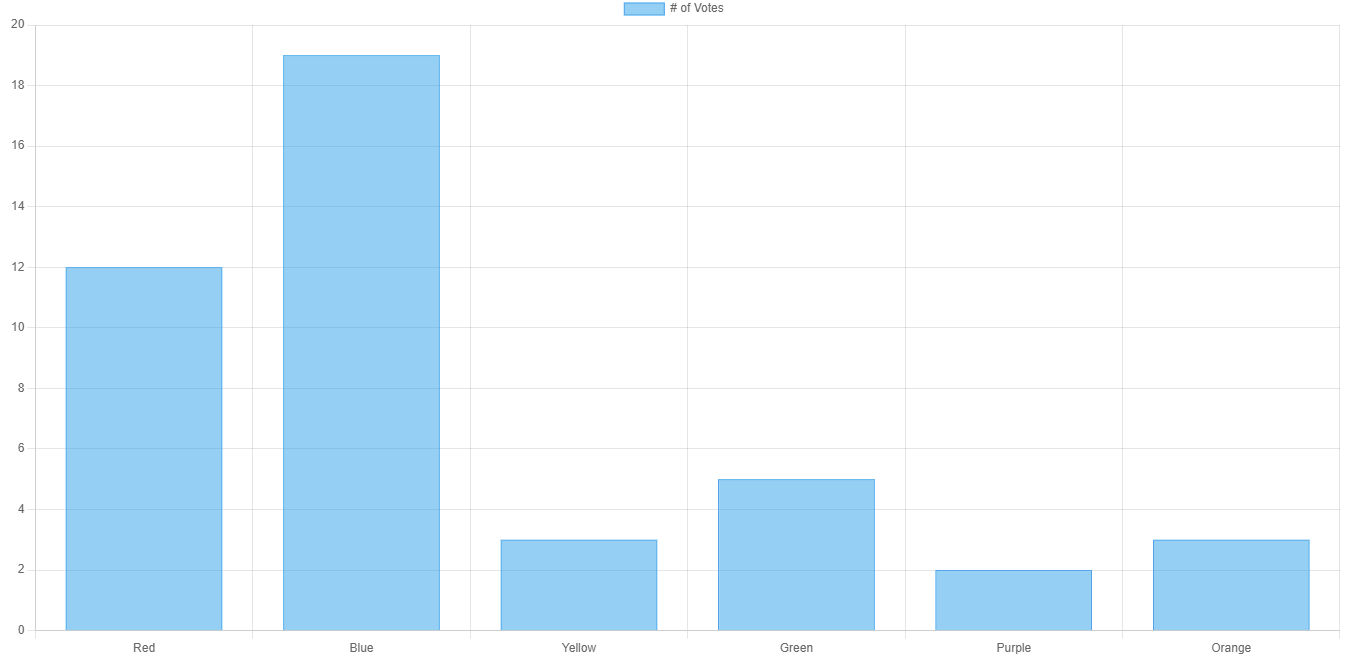
Displaying the charts with static data
How to Integrate the REST API
To integrate the REST API, head over to the Coinranking website using this link. You should see a page like this:
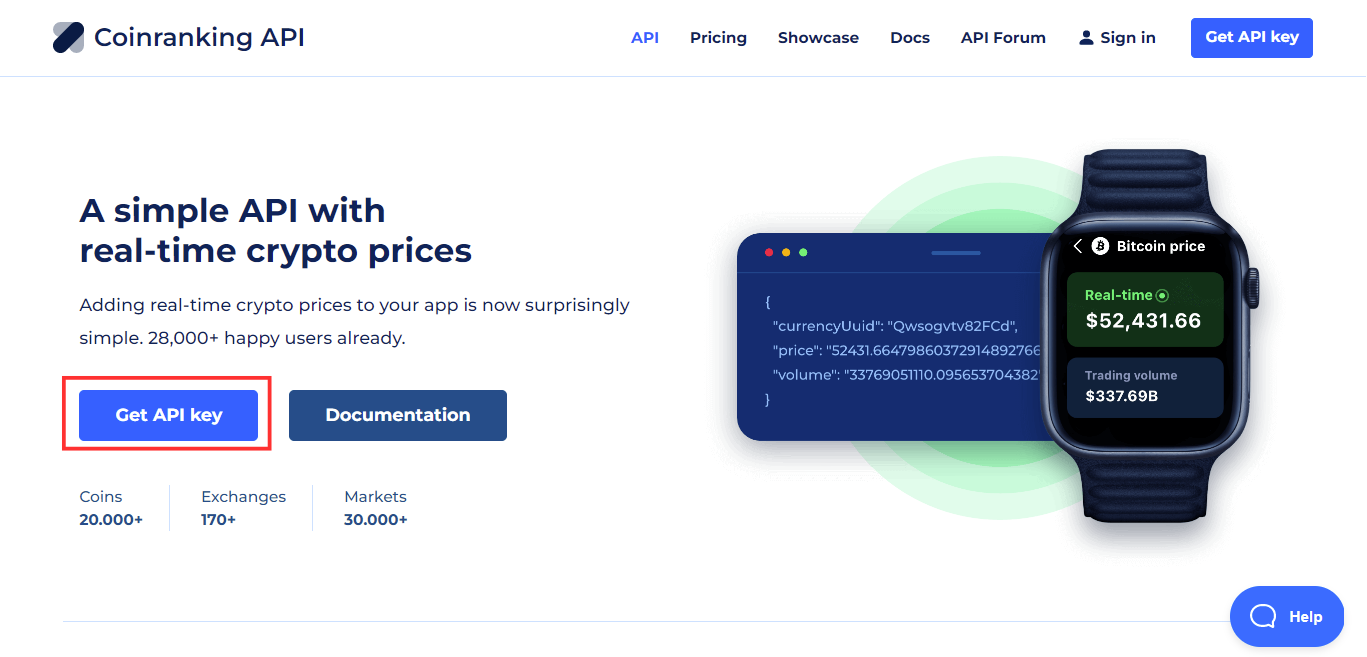
Coinranking website
Start by clicking on the "Get API Key" button. You will be directed to a page where you can create an account and have access to an API key.
Copy the API key and open the environment.ts file in your Angular project. Within the object, create a variable called API_KEY and paste in the API key generated from CoinRanking as seen below:
export const environment = {
  production: false,
  API_KEY: 'xxxxxxxxxxxxxxxxxxxxxxxxxxxxxxxxxxxxxxxxxxxxx',
};
Next, you need to copy the API to get all cryptocurrency coins from the CoinRanking documentation.
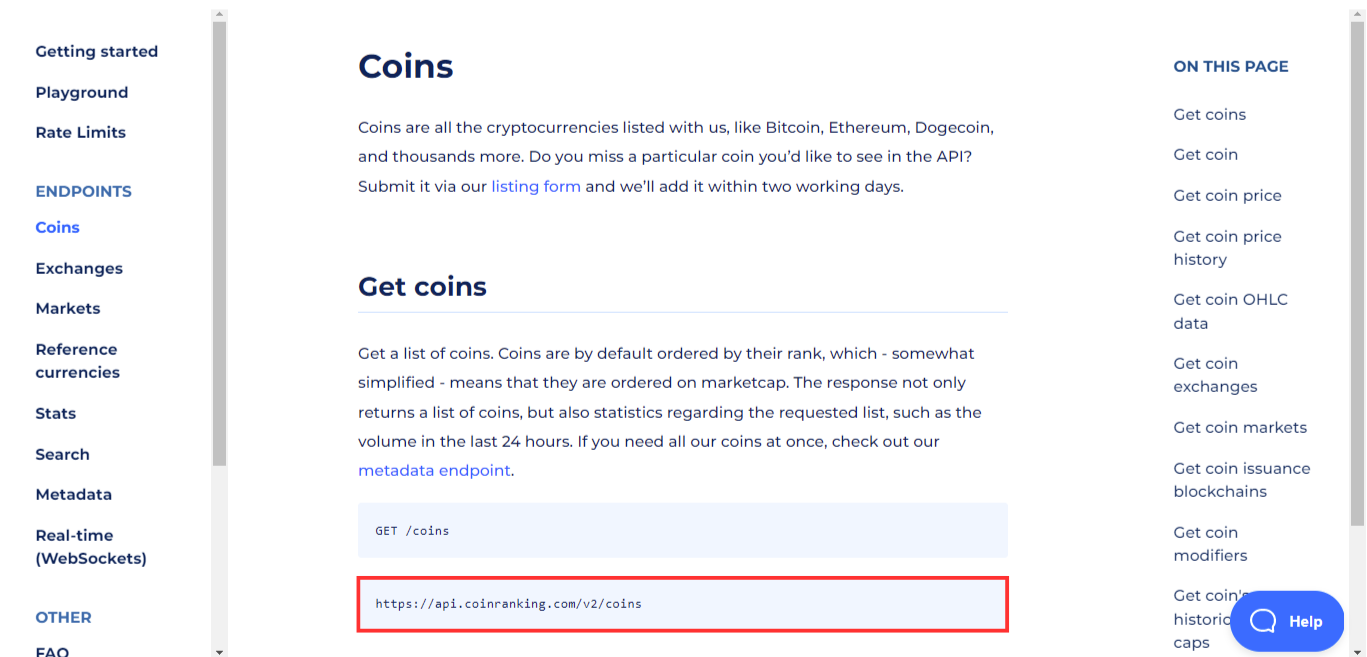
Coinranking API documentation
To use the API link copied above, you need to create an Angular Service by running the command below:
ng g service services/chart
With the chart.service.ts file created, you can now paste in the code that helps us consume the REST API as seen below:
To summarize the above code, here's what we did:
We imported the
HttpClient,HttpHeadersin line 2, as well as theenvironmentfile in line 3.Between line 5 and line 11, we created a variable called
httpOptions. ThehttpOptionsvariable holds an object that contains theHttpHeadersconfiguration imported above. Here we set the content-type, passed theAPI_KEYvariable from theenvironmentfile to the headers, and then set theAccess-Control-Allow-Originto a wildcard. This means the browser should allow request code from the origin.In line 17, we created a private variable called
baseUrlto hold the REST API, while in line 28, we created a variable calledproxyUrlto hold the CORS Anywhere link. The CORS Anywhere link is a NodeJS proxy that adds CORS headers to the proxied request and helps to prevent CORS errors in the process.In line 20, we injected the
HttpClientinto the constructor which makes it accessible within the Service.Finally, we created a function called
cryptoData()in line 22. Within this function lies a variable calledurl. We used theurlvariable to append both theproxyUrlandbaseUrlvariables to construct our API. Furthermore, in thereturnstatement, we used theget()http method to fetch the data from the REST API.
To make the HttpClient work, you need to import and inject the HttpClientModule into the app.module.ts file which can be seen below:
import { NgModule } from '@angular/core';
import { BrowserModule } from '@angular/platform-browser';
import { HttpClientModule } from '@angular/common/http';

import { AppComponent } from './app.component';

@NgModule({
  declarations: [AppComponent],
  imports: [BrowserModule, HttpClientModule],
  providers: [],
  bootstrap: [AppComponent],
})
export class AppModule {}
As seen above, the HttpClientModule was imported and injected into the imports array.
How to Display the Data in the Chart
To display the data on the chart, you need to head to the app.component.ts file and bring in your Chart service file as seen below:
As seen above, we begin by importing the Chart Service and injecting it into our component in line 3 and line 17 respectively.
We created three variables called
result,coinPrice, andcoinName. These variables will be used later in the project to hold data.Within the
ngOnInit()lifecycle hook, we called thecryptoData()function inline 20, which returns an observable that gets subscribed to. This allows us to return a response from the data in the process.In line 21, we called the
resultvariable using thethiskeyword and set it to hold the data.Next, in line 22 and line 23, we called the coinPrice and coinName variables, mapped through the data, and attached the coin price and coin name to them respectively.
To see the results of the data in the browser, we used the
console.log()function to display the data, as seen below:
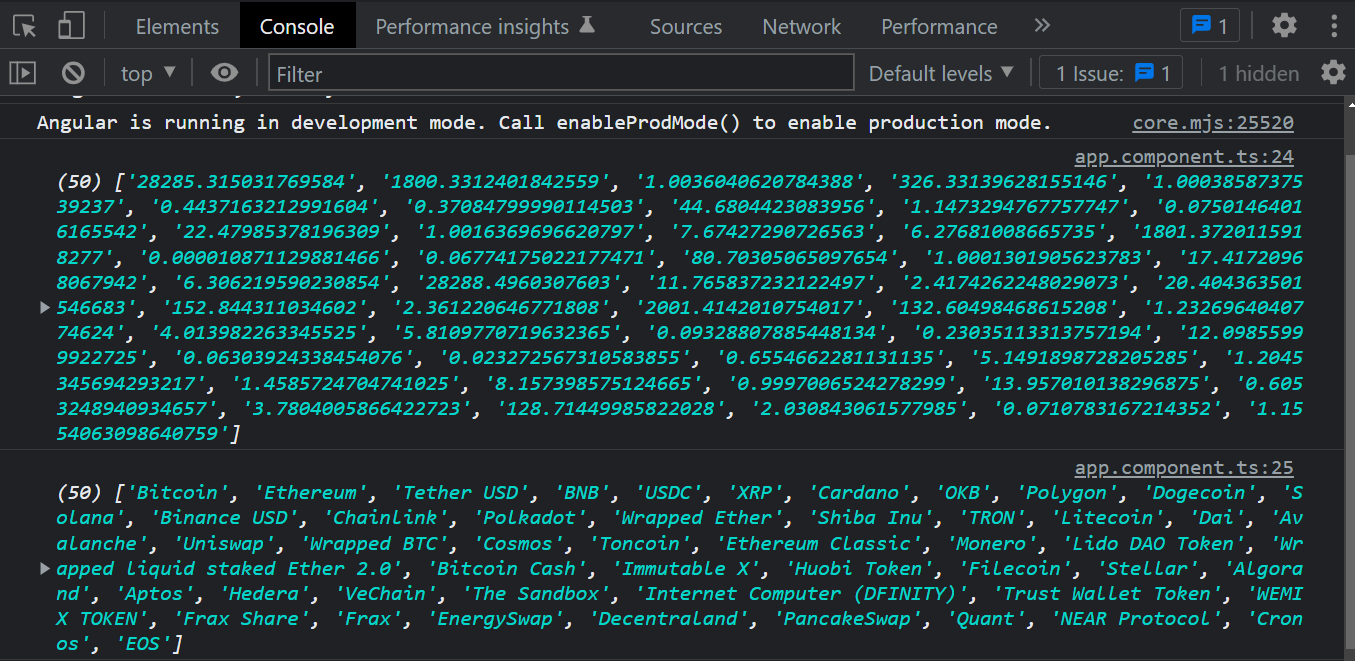
Data from the CoinRanking API displayed on the console.
The final thing to be done is to plot the data seen in the image above into chart.
As seen above, we first replaced the static data in the labels in line 12 with the coin name gotten from the CoinRanking API.
Next, we replaced the static data in line 15 with the price gotten from the CoinRanking API.
Now compile the project by running the ng serve --open command and see the results in the browser as seen below:
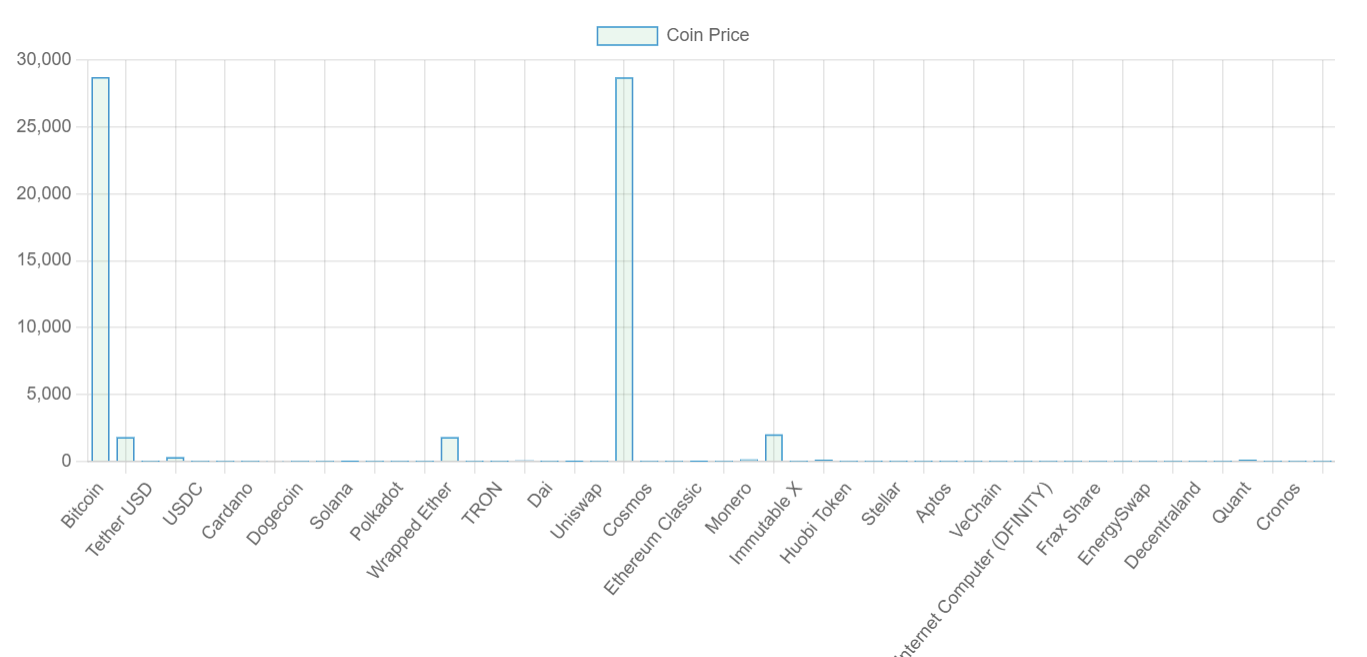
Final results of the chart
Note: There is a possibility that you'll run into an error that says (Failed to load resource: the server responded with a status of 403 (Forbidden)) after compiling the project.
What you need to do is to click on the CORS Anywhere link in the console which will open up in a new tab, with a button that says Request temporary access to the demo server. Click the button and then refresh the page. The data should now reflect on the chart.
Conclusion
In this tutorial, you learned how to install and integrate the Chart.js library and a REST API in an Angular application. If you want access to the code base, you can clone the repo here on GitHub.
If you enjoyed this article, you can show your support by subscribing to my YouTube channel where I create awesome tutorials on web development technologies like JavaScript, React, Angular, Node.js, and more.