By Jared Wolff
This post is originally from www.jaredwolff.com
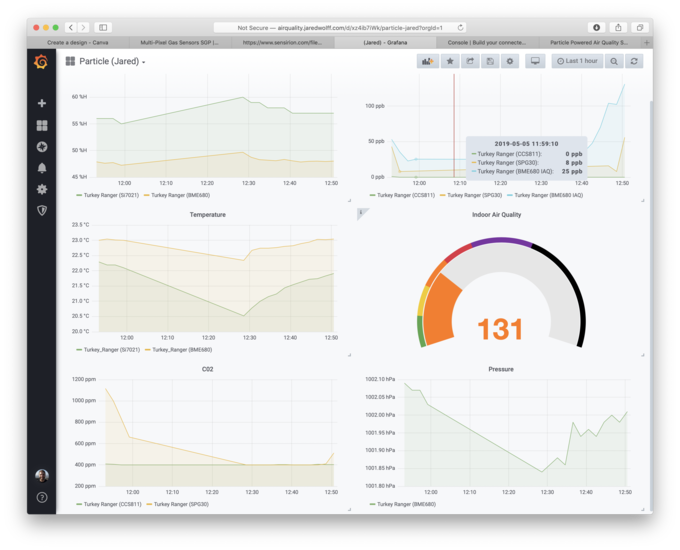
In this post, I’m going to show you how to get started with Grafana and InfluxDB. All of this running docker container on Digital Ocean.
That way you can have pretty graphs like these:
The cost?
$5 a month
Let’s get to it.
Steps
- Login to Digital Ocean. If you don’t have Digital Ocean and would like to support this blog click here to create an account.
- Go to
Account Settings->Securityand make sure you have an SSH key setup.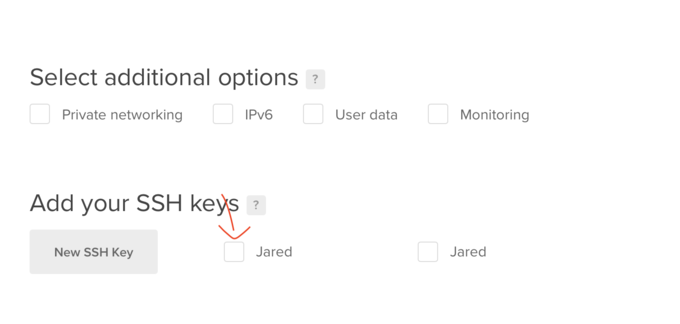
- Create a new droplet use their docker image
- Make sure you select the $5 a month plan. For simple installs, this is more than enough!
- SSH in once you’re done:
ssh root@<yourserverip> Set up InfluxDB
docker run --rm -e INFLUXDB_HTTP_AUTH_ENABLED=true -e INFLUXDB_DB=particle -e INFLUXDB_ADMIN_ENABLED=true -e INFLUXDB_ADMIN_USER=admin -e INFLUXDB_USER=grafana -v influxdb:/var/lib/influxdb influxdb /init-influxdb.shWatch the output of this command. It will generate passwords for both your
adminandgrafanauser. Save these in a safe place!Start influx
   docker run -d -p 8086:8086 \
         -v influxdb:/var/lib/influxdb \
         -e INFLUXDB_HTTP_AUTH_ENABLED=true \
         influxdb
Add firewall rule
ufw allow 8086This allows the outside world to get to your InfluxDB instance.
Set up curl from Particle
Example equivalent call:
curl -i -XPOST 'http://<DOCKER IP HERE>:8086/write?db=particle' --data-binary 'temperature,id=<ID HERE> value=22.1'The version of this to put in the custom request would be:
temperature,id={{{PARTICLE_DEVICE_ID}}} value={{{temperature}}}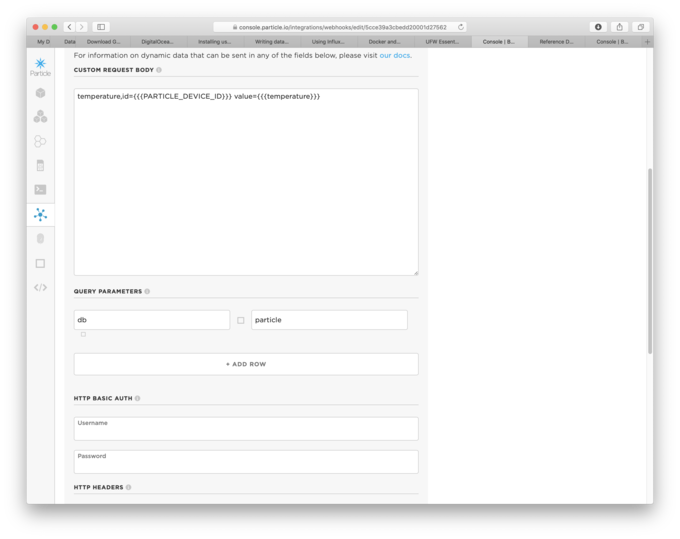
Note: see under
QUERY PARAMETERSthatdbis pointing toparticle. This should point to whatever you setINFLUXDB_DBto in step 6Second Note: make sure that the username and password is the one you set up on step 6 as well. In this example the username is
grafana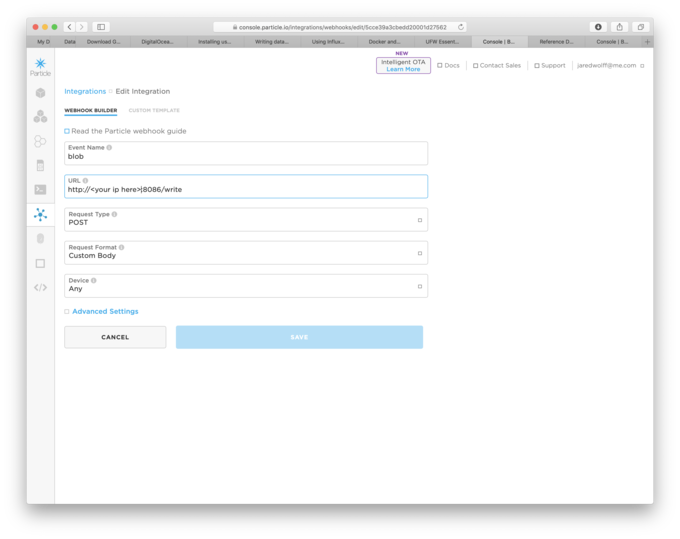
Here’s a more complex version:
   temperature,id={{{PARTICLE_DEVICE_ID}}} value={{{temperature}}}
   humidity,id={{{PARTICLE_DEVICE_ID}}} value={{{humidity}}}
   tvoc,id={{{PARTICLE_DEVICE_ID}}} value={{{tvoc}}}
   c02,id={{{PARTICLE_DEVICE_ID}}} value={{{c02}}}
   {{#pm25}}pm25,id={{{PARTICLE_DEVICE_ID}}} value={{{pm25}}}{{/pm25}}
   {{#pm10}}pm10,id={{{PARTICLE_DEVICE_ID}}} value={{{pm10}}}{{/pm10}}
   {{#sgp30_tvoc}}sgp30_tvoc,id={{{PARTICLE_DEVICE_ID}}} value={{{sgp30_tvoc}}}{{/sgp30_tvoc}}
   {{#sgp30_c02}}sgp30_c02,id={{{PARTICLE_DEVICE_ID}}} value={{{sgp30_c02}}}{{/sgp30_c02}}
   {{#bme680_pres}}bme680_pres,id={{{PARTICLE_DEVICE_ID}}} value={{{bme680_pres}}}{{/bme680_pres}}
   {{#bme680_iaq}}bme680_iaq,id={{{PARTICLE_DEVICE_ID}}} value={{{bme680_iaq}}}{{/bme680_iaq}}
   {{#bme680_temp_calc}}bme680_temp_calc,id={{{PARTICLE_DEVICE_ID}}} value={{{bme680_temp_calc}}}{{/bme680_temp_calc}}
   {{#bme680_hum_calc}}bme680_hum_calc,id={{{PARTICLE_DEVICE_ID}}} value={{{bme680_hum_calc}}}{{/bme680_hum_calc}}
For conditional data you can wrap the whole line in the variable that may or may not be there:
{{#bme680_pres}}<insert stuff related to bme680_pres>{{/bme680_pres}}Next! Install Grafana with persistent storage
  # create a persistent volume for your data in /var/lib/grafana (database and plugins)
  docker volume create grafana-storage

  # start grafana
  docker run \
    -d \
    -p 3000:3000 \
    --name=grafana \
    -v grafana-storage:/var/lib/grafana \
    grafana/grafana
Add firewall rule for graphana
    ufw allow 3000
    `
Login. This should be your Digital Ocean Droplet ip + :3000 appended. Example:
123.456.789.101:3000(Default username and password is admin and admin)Connect Grafana to Influx (should be one of the first options on a fresh Grafana install)
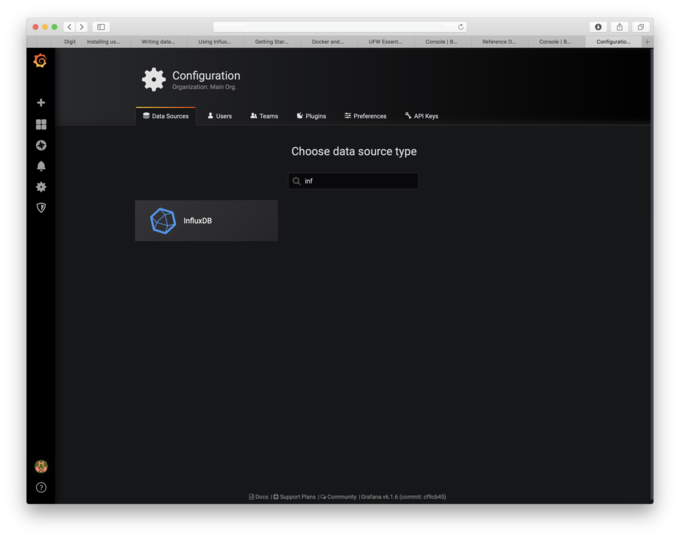
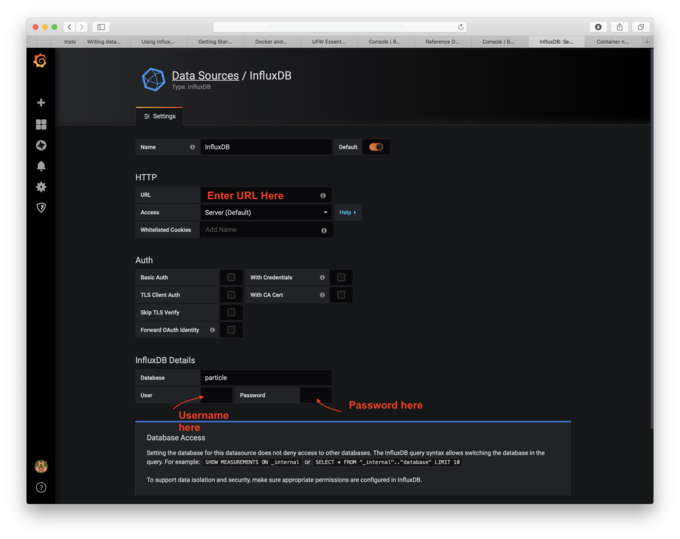
Note under user, you’ll have to put the username
grafanaand the generated password from step 6. Also the name of the database has been set asparticlein the same step.Test your connection by clicking
Save & TestIt should come back quickly saying whether or not a connection has been successful.Start up your device, if not already, and get it publishing to your InfluxDB database.
(Need data? This project should get you some!)
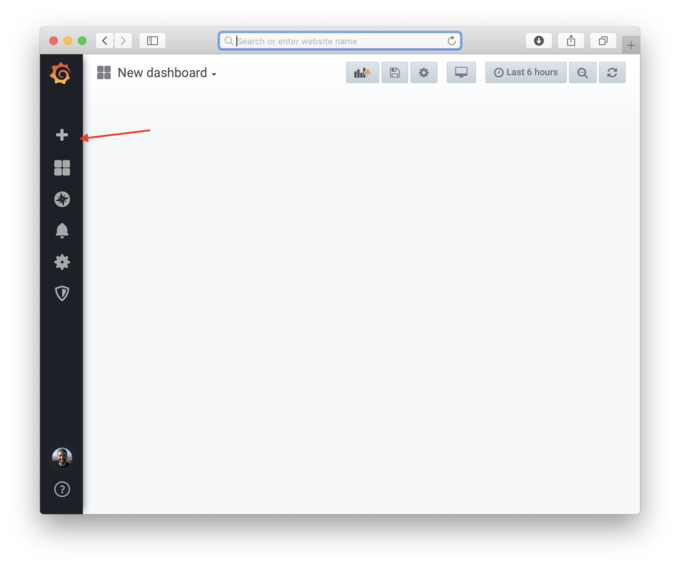
Create graphs!
Finally, the reason why you came to this page: pretty graphs
Click the + icon on the left and create a new dashboard
Select
Add Query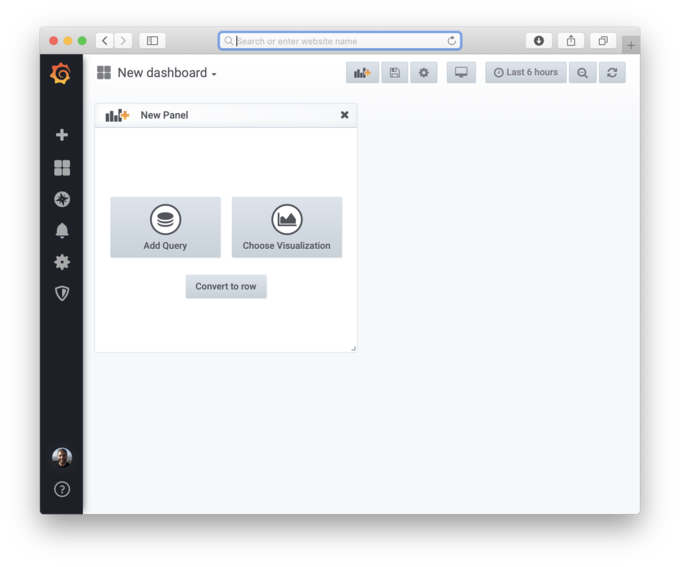
Go down and click
select measurementIf your device has been publishing to your database, you should see some options for values.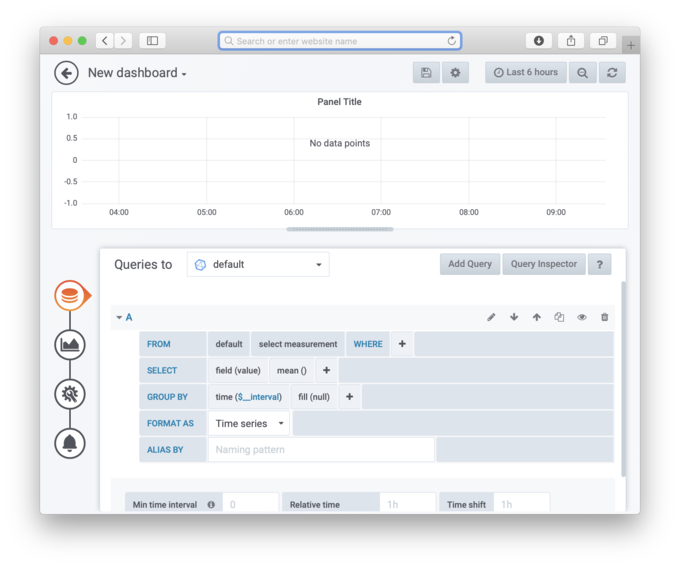
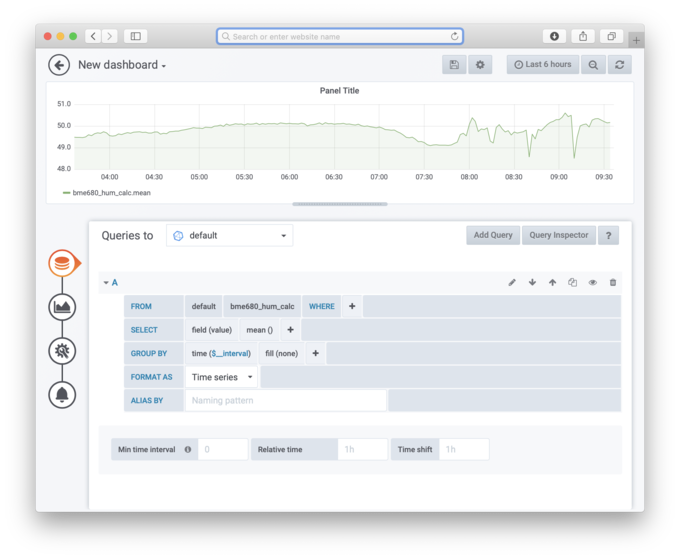
Under
fill(null)change that tofill(none). That should give you a nice line between datapoints.- You should see the graph appear!
- Click the back arrow button and then click the save button.
- You now created a simple graph on the data directly from your device! I recommend you play around with the Grafana interface. It's fairly intuitive and takes only a few short minutes to get used to!
HTTPS/SSL
Installing HTTPS/SSL is fairly straight forward. Follow the steps below:
- Stop the Grafana instance if you haven't already
Start a new container with
nginx-proxydocker run --detach \ --name nginx-proxy \ --publish 80:80 \ --publish 443:443 \ --volume /etc/nginx/certs \ --volume /etc/nginx/vhost.d \ —volume /usr/share/nginx/html \ —volume /var/run/docker.sock:/tmp/docker.sock:ro \ jwilder/nginx-proxyRun the
letsencrypt-nginx-proxy-companiondocker run —detach \ —name nginx-proxy-letsencrypt \ —volumes-from nginx-proxy \ —volume /var/run/docker.sock:/var/run/docker.sock:ro \ jrcs/letsencrypt-nginx-proxy-companionRestart the Grafana container
docker run \
  -d \
    --env "VIRTUAL_HOST=<YOUR SUBDOMAIN ADDRESS>" \
  --env "VIRTUAL_PORT=3000" \
  --env "LETSENCRYPT_HOST=<YOUR SUBDOMAIN ADDRESS>" \
  --env "LETSENCRYPT_EMAIL=<YOUR EMAIL ADDRESS>" \
  --name=grafana \
  -v grafana-storage:/var/lib/grafana \
  grafana/grafana
Note: make sure you replace
<YOUR SUBDOMAIN ADDRESS>and<YOUR EMAIL ADDRESS>above with your own info.
The proxy companion will generate an SSL certificate for the virtual host that you provided to the Grafana container. The proxy is used to forward all HTTP/HTTPS traffic to your Grafana container. It's clean, it's simple and it's secure!
Note InfluxDB is a bit more difficult. You either need to make a separate subdomain or configure HTTPS to share the certs between Grafana and Influx. This Docker Compose script does it all if you haven't already installed everything. You can follow the same steps above if you want to run it on a separate sub-domain.
Handy Links
Here are some handy links that I found useful getting started with Grafana + InfluxDB
- influxdb | Docker Documentation
- Getting Started | Grafana Documentation
- Installing using Docker | Grafana Documentation
- Let's Encrypt Nginx Proxy Companion
- Very Handy about Setting up HTTPS for both Grafana and Influx
Conclusion
You made it. Enjoy your new Grafana + InfluxDB install!
If you liked this tutorial, please share with your friends and your enemies. Also if you’re craving more, check out how to build your own air quality sensor using only a few parts.