
By Swatej Patil
In this tutorial we will learn how to create a simple pie and doughnut chart using the Chart.js library in an Angular application.
What is Chart.js?
Chart.js is a JavaScript library for building charts. It's designed to be intuitive and simple, but it's powerful enough to build complex visualizations.
It has a wide range of chart types, including bar charts, line charts, pie charts, scatter plots, and many more. Chart.js is open-source and can be used without any restrictions on private or commercial projects.
Prerequisites
Before we get started with making the charts, just make sure you meet the following prerequisites:
- Basic understanding of HTML /CSS and TypeScript especially the understanding of Object Oriented concepts of TypeScript classes and methods.
- Node.js version 10 or higher and NPM or Yarn package manager. You can download node.js from here.
How to Install Angular CLI
We will be using the Angular CLI to generate a starter application for our project. You can install Angular CLI by executing the following command on a terminal or Powershell window:
npm install -g @angular/cli
If you have Angular CLI installed already, you can skip this step.
How to Create a Angular Application
Now let’s create an Angular application that will hold our graphs. In a terminal, execute the following commands:
ng new angular-chartjs
Now that our Angular application has been created, navigate to the project folder and start the local development server using the following command:
cd angular-chartjs
ng serve -o
A browser window will open on http://localhost:4200/ and you can see your running Angular application.
How to Install the Chart.js Package
Now open a new terminal window in the same directory and install the Chart.js library using the following:
npm install chart.js
Now we need to create two Angular components, one for the Pie graph and the other for the Doughnut chart. You can create them easily with the angular CLI by executing the following commands:
ng generate component pie-chart
ng generate component doughnut-chart
How to Create a Pie Chart in Chart.js
A pie chart is a circular graph that displays data in slices, where each slice represents a category of data. The size of each slice represents the proportion of the category in relation to the whole data set.
Pie charts are an effective way to show the breakdown of data into categories, especially when the data represents parts of a whole. They are useful when you want to show how much each category contributes to the total.
When to use pie charts:
- To show the proportions of different categories in a whole
- To compare the relative sizes of different categories
- To demonstrate how each category contributes to the whole
Pie charts are commonly used in business and economics to show the distribution of expenditures, market shares, or other aspects of the company's performance.
Now that we have created the components, we will move on with creating the pie chart.
Navigate to the /src/app/pie-chart component and open the pie-chart.component.html file and paste the following code:
<div class="chart-container">
      <canvas  id="MyChart" >{{ chart }}</canvas>
</div>
We have simply created a container, and inside that container a canvas with an id of MyChart. We have used Angular’s string interpolation to render the chart variable, which we will create soon.
Inside the pie-chart component, open the pie-chart.component.ts file and import the Chart.js library using the following command:
import Chart from 'chart.js/auto';
Now let’s make the chart variable we mentioned earlier. This variable will hold the information of our graphs.
public chart: any;
Now we will create a method for the pie chart. This will include the data and labels for our chart.
Copy the following code and paste it in the pie-chart.component.ts file below the ngOnInit() function:
createChart(){

    this.chart = new Chart("MyChart", {
      type: 'pie', //this denotes tha type of chart

      data: {// values on X-Axis
        labels: ['Red', 'Pink','Green','Yellow','Orange','Blue', ],
           datasets: [{
    label: 'My First Dataset',
    data: [300, 240, 100, 432, 253, 34],
    backgroundColor: [
      'red',
      'pink',
      'green',
            'yellow',
      'orange',
      'blue',
    ],
    hoverOffset: 4
  }],
      },
      options: {
        aspectRatio:2.5
      }

    });
  }
Here we have set the type of chart as pie. We have given labels as the names of common colors. And we've added data values, which will be automatically allocated a portion of pie in the pie chart.
We want our createChart() function to run as soon as the page loads. In order to do that, we need to call the function in the ngOnInit():
ngOnInit(): void {
    this.createChart();
  }
Finally, we need to add the HTML selector of the pie-chart component to the app.component.html file. Remove the initial template code of Angular and add the following:
<app-pie-chart></app-pie-chart>
Save all the files and the browser window will refresh automatically. Your first pie chart is ready!
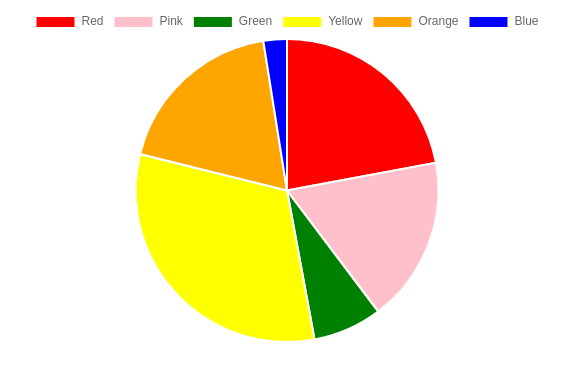 Our pie chart
How to Create a Doughnut Chart in Chart.js
A doughnut chart is a variation of the pie chart and serves the same purpose of representing data in a circular format. It is made up of multiple sectors, where each sector represents a data value, with the size of each sector proportional to its value.
You can use a doughnut chart:
- To show a parts-to-whole relationship in data
- To compare different categories of data
- To show progress towards a goal or target
Now we will move on with creating the doughnut chart. Since Doughnut charts and Pie charts can be used interchangeably, we don’t need to modify anything except the type of chart. Just follow the same steps you have done so far and make sure to do them on the doughnut chart component.
Paste the same code for createChart() method on the doughnut-chart.component.ts file below the ngOnInit() function. You just need to change the keyword for type of chart from pie to doughnut. Your code should look like the following:
createChart(){

    this.chart = new Chart("MyChart", {
      type: 'doughnut', //this denotes tha type of chart

      data: {// values on X-Axis
        labels: ['Red', 'Pink','Green','Yellow','Orange','Blue', ],
           datasets: [{
    label: 'My First Dataset',
    data: [300, 240, 100, 432, 253, 34],
    backgroundColor: [
      'red',
      'pink',
      'green',
            'yellow',
      'orange',
      'blue',
    ],
    hoverOffset: 4
  }],
      },
      options: {
        aspectRatio:2.5
      }

    });
  }
Call the createChart() function in ngOnInit() and your line chart will be ready.
ngOnInit(): void {
    this.createChart();
  }
Finally, we need to add the HTML selector for the line-chart component to the app.component.html file.
<app-doughnut-chart></app-doughnut-chart>
Your output may look like the following:
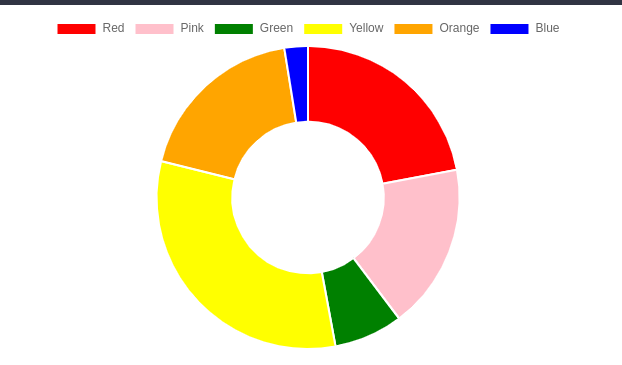 Our doughnut chart
Conclusion
Chart.js is a very useful and powerful library. If you want to include any type of chart in your Angular application, then it is very easy to make them with Chart.js.
The full code for this Angular application is hosted on my GitHub Repo.
I hope you found this tutorial helpful. Thank you for reading!