
By Swatej Patil
In this tutorial you will learn how to the Add Chart.js Zoom plugin to an Angular application.
When you have a lot of data in a chart, you may want to zoom in and see the details. Line charts are a good way to visualise large amounts of data. You can use the zooming feature in Chart.js to explore your data more closely.
Chart.js is an open-source library you can use to create beautiful charts in any part of your Angular application. The Zooming feature was created to allow you to magnify certain data points for closer inspection. You can quickly and easily zoom by scrolling with the mouse wheel.
Let's see how it works.
Getting Started
I'm going to assume that you already know how to use Chart.js in an Angular application to create simple line and bar charts.
Don't worry if you don't – I've got you covered. You can follow my Chart.js Tutorial – How to Make Bar and Line Charts in Angular to get started.
We will create a new Angular component just for the line chart and then incorporate the zoom plugin into it. We will be using a large amount of data to see how useful the Zoom plugin is.
But first, in your Angular application, you'll need to install the Chart.js Zoom plugin if you don't already have it.
Open up a new terminal in the Angular project folder and paste in the following command:
npm install chartjs-plugin-zoom
This will install the plugin into your Angular application.
Now let’s create a new Angular component and make the line chart. Use the following to create a new Angular component:
ng g c line-chart
This will create a new Angular component in the /src directory.
Then open the line-chart.component.html file and paste in the following code:
<div class="chart-container">
      <canvas  id="MyChart" >{{ chart }}</canvas>
</div>
Now open the line-chart.component.ts file and delete all the code inside it. Then paste in the following code:
import { Component, OnInit } from '@angular/core';
import Chart from 'chart.js/auto';

@Component({
  selector: 'app-line-chart',
  templateUrl: './line-chart.component.html',
  styleUrls: ['./line-chart.component.css']
})
export class LineChartComponent implements OnInit {

  constructor() { }

  ngOnInit(): void {
    this.createChart();
  }
  public chart: any;

  createChart() {

    this.chart = new Chart("MyChart", {
      type: 'line', //this denotes tha type of chart

      data: {// values on X-Axis
        labels: ["Monday", "Tuesday", "Wednesday", "Thursday", "Friday", "Saturday", "Sunday",
          "Monday", "Tuesday", "Wednesday", "Thursday", "Friday", "Saturday", "Sunday",
          "Monday", "Tuesday", "Wednesday", "Thursday", "Friday", "Saturday", "Sunday",
          "Monday", "Tuesday", "Wednesday", "Thursday", "Friday", "Saturday", "Sunday",
          "Monday", "Tuesday", "Wednesday", "Thursday", "Friday", "Saturday", "Sunday",
          "Monday", "Tuesday", "Wednesday", "Thursday", "Friday", "Saturday", "Sunday",
          "Monday", "Tuesday", "Wednesday", "Thursday", "Friday", "Saturday", "Sunday",
          "Monday", "Tuesday", "Wednesday", "Thursday", "Friday", "Saturday", "Sunday",
          "Monday", "Tuesday", "Wednesday", "Thursday", "Friday", "Saturday", "Sunday",
          "Monday", "Tuesday", "Wednesday", "Thursday", "Friday", "Saturday", "Sunday"],
        datasets: [
          {
            label: "Sales",
            data: ['467', '576', '572', '79', '92', '574', '573',
            '467', '576', '572', '79', '92', '574', '573',
            '467', '576', '572', '79', '92', '574', '573',
            '467', '576', '572', '79', '92', '574', '573',
            '467', '576', '572', '79', '92', '574', '573',
            '467', '576', '572', '79', '92', '574', '573',
            '467', '576', '572', '79', '92', '574', '573',
            '467', '576', '572', '79', '92', '574', '573',
            '467', '576', '572', '79', '92', '574', '573',
            '467', '576', '572', '79', '92', '574', '573', ],
            backgroundColor: 'blue',
            borderColor: "#084de0"
          }
        ]
      },
      options: {
        aspectRatio: 3
      }

    });
  }

}
Again, if you don’t know how this code works, you can always refer back to this Chart.js Tutorial.
We need to add the HTML selector of the line-chart component to the app.component.html file. Remove the initial template code of Angular and add the following:
<app-line-chart></app-line-chart>
Start the local development server using the following command:
ng serve -o
A browser window will open on http://localhost:4200/ and you can see your running Angular application.
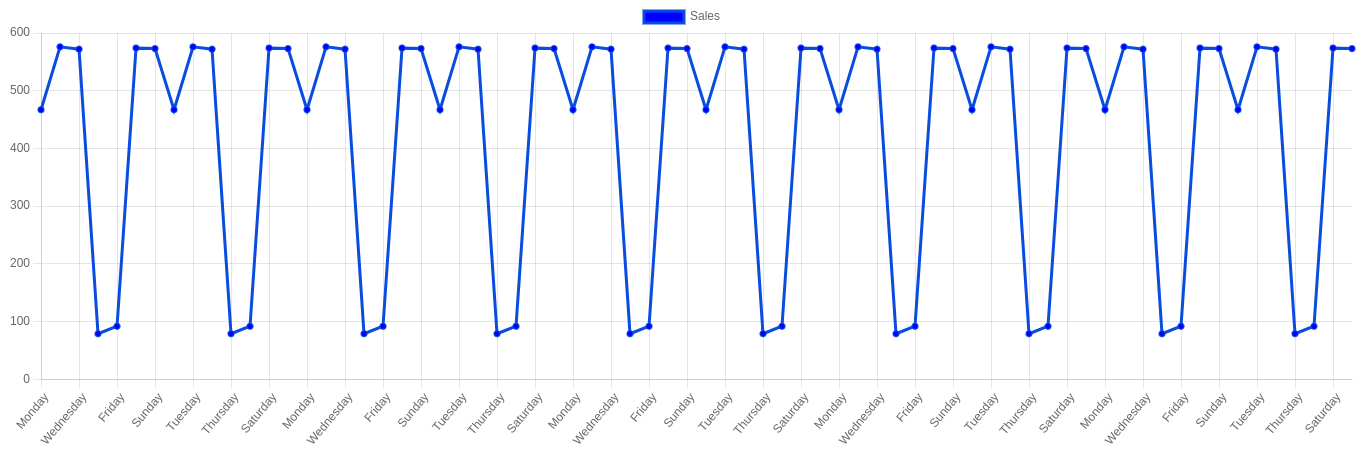
As you can see, in order to present the entire chart, this graph begins to skip some labels. It will seem more worse if the graph has more data.
Let's now add a zooming function to our chart so we can enlarge the data points for a closer look.
How to Add the Chart.js Zoom Plugin
Open the line-chart.component.ts file and import the chart.js Zoom plugin. Make sure you register it after importing it. The following code will show you how to do it:
import zoomPlugin from 'chartjs-plugin-zoom';
Chart.register(zoomPlugin);
Now that you have imported the plugin, in the Chart.js option we will add the plugin and enable the zoom on the wheel.
options: {
        aspectRatio: 3,
        plugins: {
          zoom: {
            zoom: {
              wheel: {
                enabled: true,
              },
              pinch: {
                enabled: true
              },
              mode: 'xy',
            }
          }
        }
      }
As you can see , now we can zoom in into the point we want to see closely.
Wrapping Up
The full code for this Angular application is hosted on my GitHub.
I hope you found this tutorial helpful.If you have any questions or comments, please do not hesitate to contact me on LinkedIn. I'll be more than pleased to assist you with your questions.
Thank you for reading!
Photo by Isaac Smith on Unsplash