By Rishit Dagli
What if you could monitor your Colab, Kaggle, or AzureML Machine Learning projects on your mobile phone? You'd be able to check in on your models on the fly – even while taking a walk🚶.
If you are an ML developer, you know how training models can easily take a long time. How cool would it be to monitor this from your mobile phones?
Well, you can do it – and in <5 lines of code.
Why Monitoring Your Models Remotely Helps
Before getting on with the tutorial and showing you how it works, let me briefly describe what you can do with TF Watcher, an open-source project we will use to monitor our ML jobs:
- Integrates seamlessly with your ML workflow, so you don't need to change any other code in your workflow to make it work
- All your visualizations and dashboards are real-time
- You probably want to share your live dashboard or a previously run dashboard with your colleagues, and this also allows you to create shareable links
- It's a PWA which lets you monitor your models offline in a limited capacity
- You also get precise control over when you want to log the metrics
How to Monitor Your ML Projects on Your Phone
Let's now go through the tutorial of how to monitor your models on a mobile device with Google Colab. I'll show you how to use tool this in Google Colab, so anyone can try it out, but you can pretty much replicate this anywhere (even on your local machine).
Feel free to follow along with this colab notebook.
Install the tf-watcher Python Package
To monitor your Machine Learning jobs on mobile devices, you need to install the tf-watcher Python package. This is an open-source Python package that I built, and you can find the source code in this GitHub repo.
To install the Python package from PyPI, run the following command in your notebook cell:
!pip install tf-watcher
How to Create a Simple Model
For the purposes of this example, we will see how you can monitor a training job – but you can use this package to monitor your evaluation or prediction jobs too. You will soon also see how you can easily specify the metrics you want to monitor.
In this example, we’ll use the Fashion MNIST, a simple dataset of 60,000 grayscale images of 10 fashion categories. We start by loading the dataset and then we'll do some simple preprocessing to further speed up our example.
However, you can use everything we talk about in this article in your more complex experiments.
Let's fetch the dataset:
import tensorflow as tf

# Load example MNIST data and pre-process it
(x_train, y_train), (x_test, y_test) = tf.keras.datasets.mnist.load_data()

x_train = x_train.reshape(-1, 784).astype("float32") / 255.0
x_test = x_test.reshape(-1, 784).astype("float32") / 255.0

# Limit the data to 1000 samples to make it faster
x_train = x_train[:1000]
y_train = y_train[:1000]
x_test = x_test[:1000]
y_test = y_test[:1000]
Now we'll create a simple neural network that just has a single Dense layer. I'll be showing you how to use this with the TensorFlow's Sequential API, but this works in the exact same way while using the Functional API or subclassed models, too.
# Define the Keras model
def get_model():
    model = keras.Sequential()
    model.add(keras.layers.Dense(1, input_dim=784))
    model.compile(
        optimizer=keras.optimizers.RMSprop(learning_rate=0.1),
        loss="mean_squared_error",
        metrics=["accuracy"],
    )
    return model
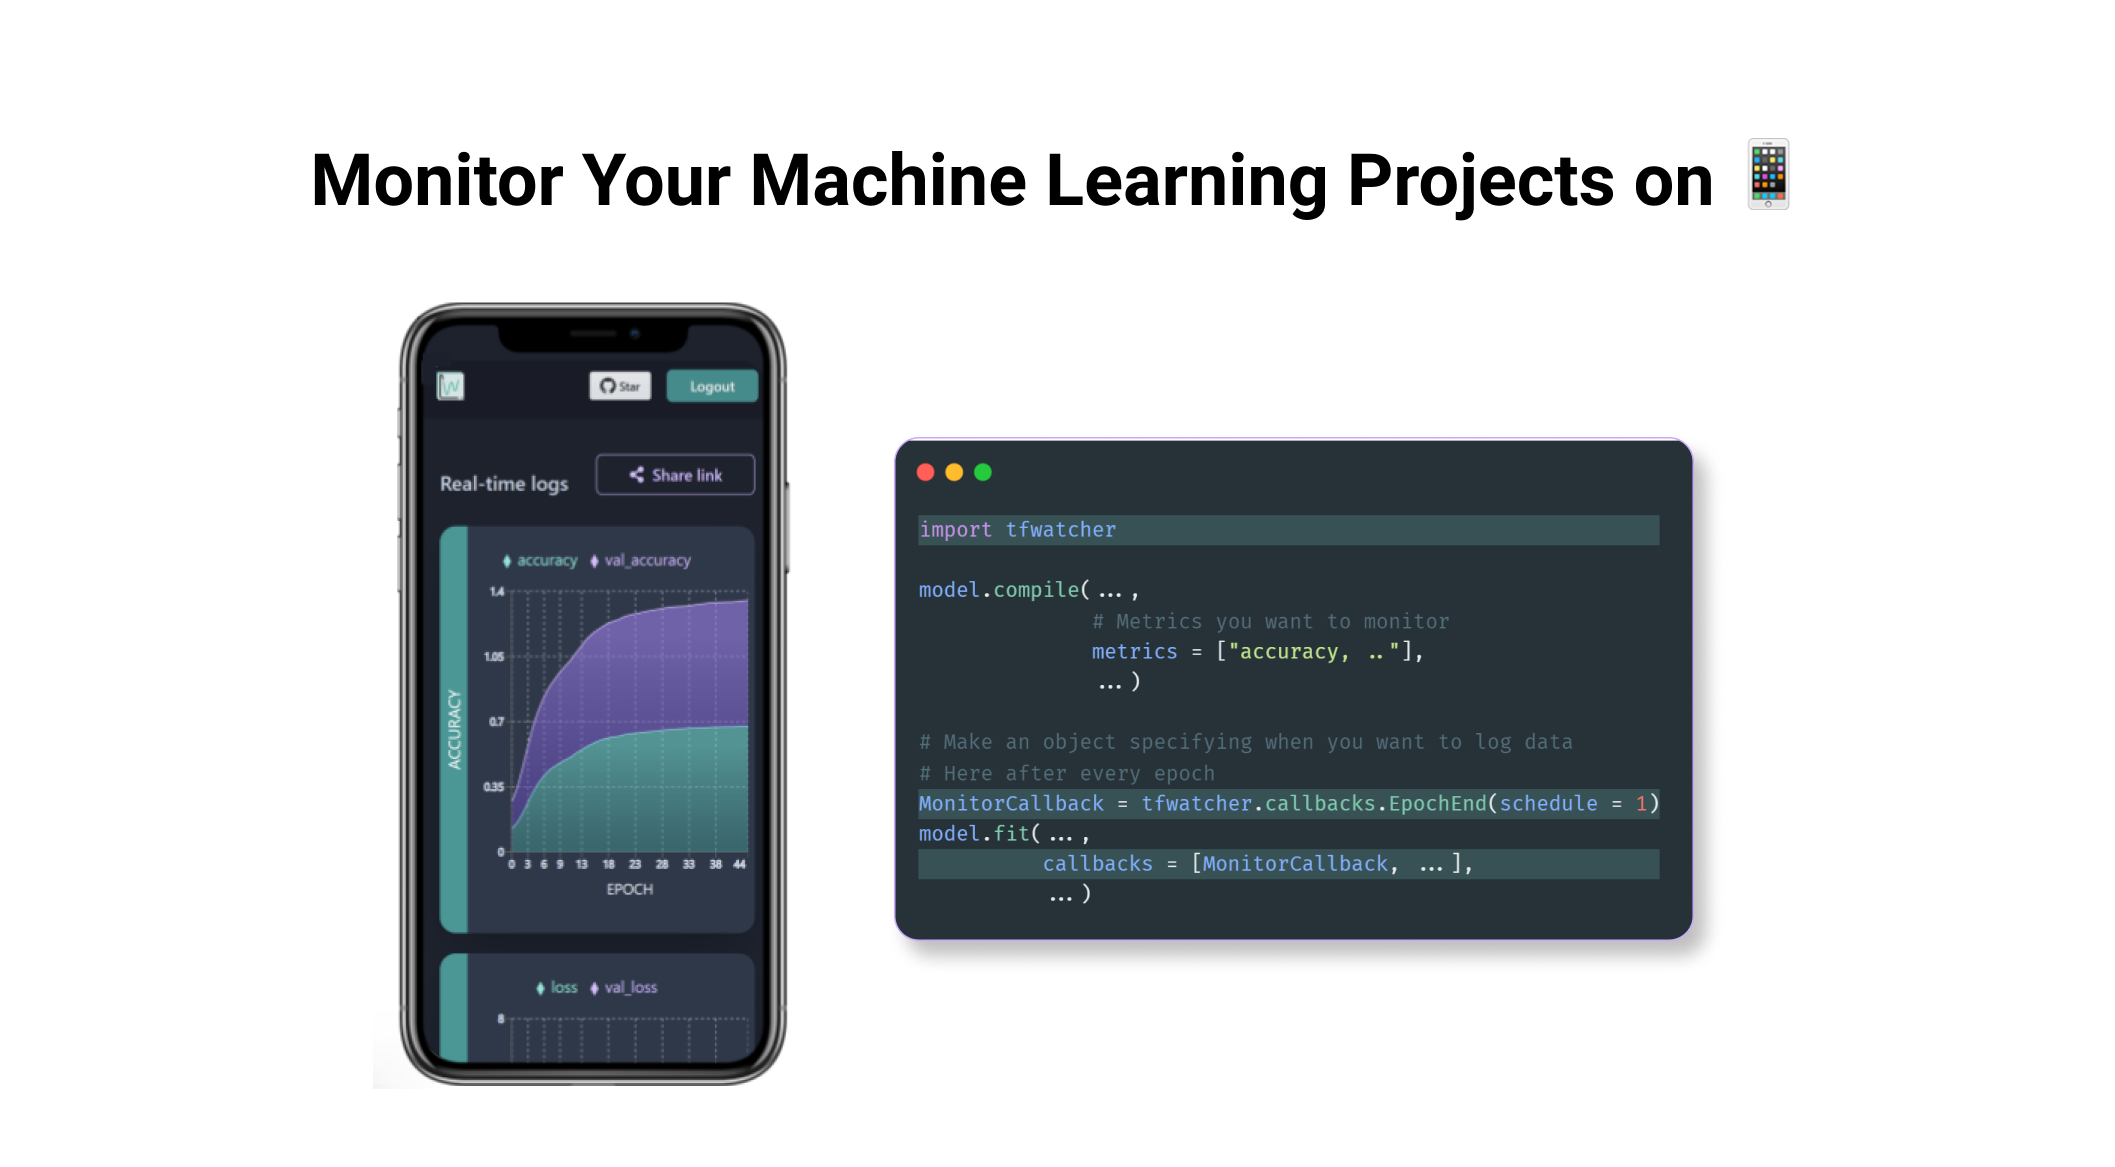
You might have noticed that while compiling our model, we also specified metrics which lets us specify which metrics we need to monitor.
Here I mention "accuracy" so I should be able to monitor accuracy on my mobile device. By default, we logged "loss" so in this case, we would be monitoring 2 metrics: loss and accuracy.
You can add as many metrics as you need. You can also use TensorFlow's built-in metrics or add your own custom metric, too.
How to Create an Instance of a Callback Class
You will now import TF Watcher and create an instance of one of its classes:
import tfwatcher

MonitorCallback = tfwatcher.callbacks.EpochEnd(schedule = 1)
In this example:
- We use the
EpochEndclass from TF Watcher to specify that we are interested in operating in the epoch level. There are quite a few of these classes which you can use for your own needs – find out all about the other classes in the documentation. - We pass in
scheduleas 1 to monitor after every 1 epoch. You could pass in 3 instead (to monitor after every 3 epochs) or you could also pass in a list of the specific epoch numbers you want to monitor.
When you run this piece of code, you should see something like this printed out:
 Unique ID for your session
This includes a unique 7 character ID for your session. Be sure to make a note of this ID as you will use it to monitor your model.
How to Start Monitoring Your Model 🚀
Now we will train the model we built and monitor the real-time metrics for training on a mobile device.
model = get_model()

history = model.fit(
    x_train,
    y_train,
    batch_size=128,
    epochs=100,
    validation_split=0.5,
    callbacks = [MonitorCallback]
)
In this piece of code, we start training our model for 100 epochs (should be pretty quick in this case). We also add the object we made in the earlier step as a callback.
If in your case you are monitoring the prediction instead of training, you would add callbacks = [MonitorCallback] in the predict method.
Once you run the above piece of code, you can start monitoring it from the web app from your mobile device.
Go to https://www.tfwatcher.tech/ and enter the unique ID you created above. This is a PWA which means you can also install this on your mobile devices and use it as a native android app, too.
 Install the web app
Once you add your session ID you should be able to see your logs progressing in real-time through the charts. Apart from the metrics, you should also be able to see the time it took for each epoch. In other cases this might be time taken for a batch, too.
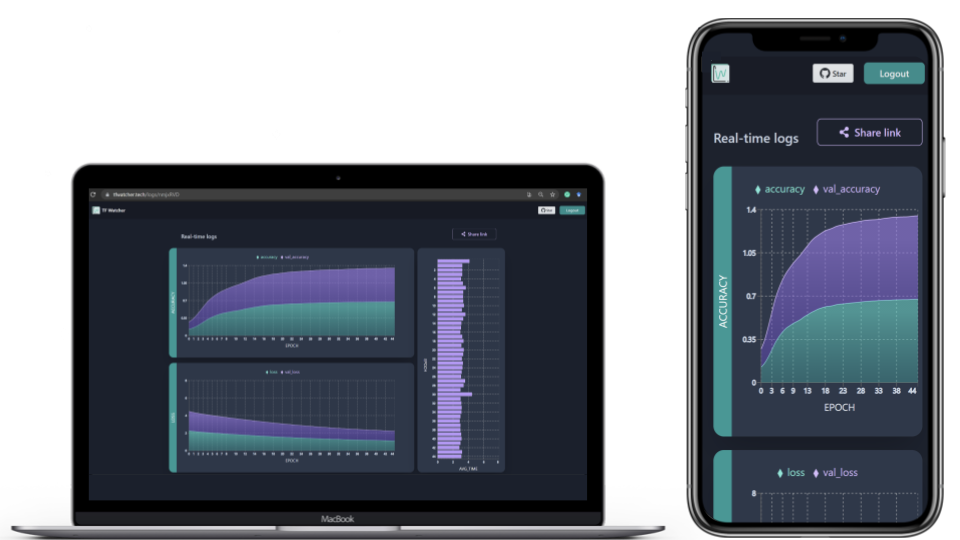 The monitoring dashboard
How to Share Dashboards
Since ML is highly collaborative, you might want to share your live dashboards with colleagues. To do so, just click the share link button and the app creates a shareable link for anyone to view your live progress or stored dashboards.
Here is the shareable link for the dashboard I created in this tutorial.
What Else Can You Do with TF Watcher?
Though the example I just showed looked quite cool, there is a lot more we can do with this tool. Now I will briefly talk about two of those scenarios: Distributed Training and non-eager execution.
Distributed Training
You might often distribute your Machine Learning training across multiple GPUs, multiple machines, or TPUs. You're probably doing this with the [tf.distribute.Strategy](https://www.tensorflow.org/api_docs/python/tf/distribute/Strategy) TensorFlow API.
You can use it in the exact same way with most distribution strategies with limited use while using ParameterServer in a custom training loop.
 Distributed training
You can find some great examples of how to use these strategies with TensorFlow Keras here.
Non-eager execution
In TensorFlow 2, eager execution is turned on by default. But you will often want to use tf.function to make graphs out of your programs. It's a transformation tool that creates Python-independent dataflow graphs out of your Python code.
One of the earliest versions of this project used some Numpy calls but guess what, you can now use the code in the same way in non-eager mode too.
Thank you for reading!
Thank you for sticking with me until the end. You can now monitor your Machine Learning projects from anywhere on your mobile device and take them to the next level. I hope you are as excited to start using this as I was.
If you learned something new or enjoyed reading this article, please share it so that others can see it. Until then, see you in the next post!
You can also find me on Twitter @rishit_dagli.