
Observability refers to our ability to "see" and understand what's happening inside a system by looking at its external signals (like logs, metrics, and traces).
Observability involves collecting and analyzing data from sources within a system to monitor its performance and address problems effectively.
Why is Observability Useful?
Detecting and Troubleshooting Problems: Observability plays a role in identifying and diagnosing issues within a system. When something goes wrong, having access to data helps pinpoint the cause and resolve problems more quickly.
Optimizing Performance: Through monitoring metrics and performance indicators, observability helps in optimizing the performance of your system. This includes identifying bottlenecks, improving resource utilization, and ensuring operation.
Planning for Future Capacity: Understanding how your system behaves over time is vital for planning capacity requirements. Observability data can reveal trends, peak usage periods, and resource needs, helping your decisions regarding scaling.
Enhancing User Experience: By observing user interactions with your system through logs and metrics, you can improve the user experience. It assists in recognizing patterns, preferences, and potential areas that can be enhanced for user satisfaction.
Why Should I Use OpenTelementary?
Observability is essential for ensuring the reliability and availability of your Node.js applications. But manually instrumenting your code to collect and export telemetry data, such as traces, metrics, and logs, can become very stressful.
Manual instrumentation is very tedious, error-prone, and inconsistent. It can also introduce additional overhead and complexity to your application logic.
In this guide, you will learn how to use OpenTelemetry’s auto-instrumentation to help you achieve effortless Node.js monitoring.
Prerequisites
Before you go through this guide, make sure you have the following:
A Node.js application
A Datadog account and an API key. If you don't have one, you can sign up here to get one.
A Backend service. You can use a backend service like Zepkin or Jaeger to store and analyze trace data. For this guide, we'll be using Jaeger.
Some basic knowledge of Linux commands. You should be familiar with using the command line and editing configuration files.
Prepare Your Application
In this guide, you will be using a Node.js application that has two services that transfer data between themselves. You will use OpenTelemetry’s Node.js client library to send trace data to an OpenTelementay collector.
Firstly, clone the Repo Locally:
$ git clone https://github.com/<github-account>/nodejs-example.git
Then run the application:
npm install
Go to the directory of the first service using this command:
$ cd <ServiceA>
And start the first service.
$ node index.js
Then go to the directory of the second service
$ cd <ServiceB>
And start the second service.
$ node index.js
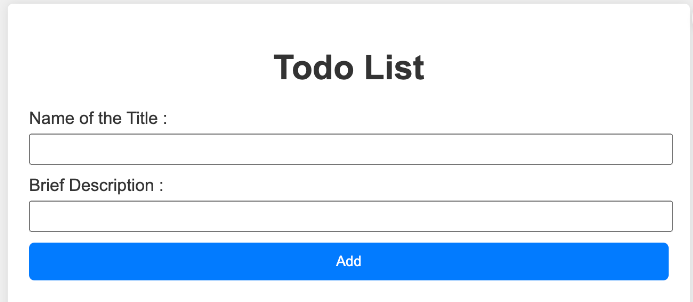
Open Service A, in this case port 5555, and input some information. Then repeat the same for Service B.
How to Set Up OpenTelementary
After starting the services, it's time to install the OpenTelementary modules you'll need for auto-instrumentation.
Here are what we need to install:
$ npm install --save @opentelemetry/api

$ npm install --save @opentelemetry/instrumentation

$ npm install --save @opentelemetry/tracing

$ npm install --save @opentelemetry/exporter-trace-otlp-http

$ npm install --save @opentelemetry/resources

$ npm install --save @opentelemetry/semantic-conventions

$ npm install --save @opentelemetry/auto-instrumentations-node

$ npm install --save @opentelemetry/sdk-node

$ npm install --save @opentelemetry/exporter-jaeger
Here's break down of what each module does:
@opentelemetry/api: This module provides the OpenTelemetry API for Node.js.@opentelemetry/instrumentation: The instrumentation libraries provide automatic instrumentation for your Node.js application. They automatically capture telemetry data without requiring manual code modifications.@opentelemetry/tracing: This module contains the core tracing functionality for OpenTelemetry in your Node.js application. It includes the Tracer and Span interfaces, which are important for capturing and representing distributed traces within your applications.@opentelemetry/exporter-trace-otlp-http: This exporter module enables sending trace data to an OpenTelemetry Protocol (OTLP) compatible backend over HTTP.@opentelemetry/resources: This module provides a way to define and manage resources associated with traces.@opentelemetry/semantic-conventions: This module defines a set of semantic conventions for tracing. It establishes a common set of attribute keys and value formats to ensure consistency in how telemetry data is represented and interpreted.@opentelemetry/auto-instrumentations-node: This module simplifies the process of instrumenting your application by automatically applying instrumentation to supported libraries.@opentelemetry/sdk-node: The Software Development Kit (SDK) for Node.js provides the implementation of the OpenTelemetry API.@opentelemetry/exporter-jaeger: This exporter module allows exporting trace data to Jaeger. Jaeger provides a user-friendly interface for monitoring and analyzing trace data.
Configure the Node.js Application
Next, add a Node.js SDk tracer to handle the instantiation and shutdown of the tracing.
To add the tracer, create a file tracer.js:
$ nano tracer.js
Then add the following code to the file:
"use strict";

const {
    BasicTracerProvider,
    SimpleSpanProcessor,
} = require("@opentelemetry/tracing");
// Import the JaegerExporter
const { JaegerExporter } = require("@opentelemetry/exporter-jaeger");
const { Resource } = require("@opentelemetry/resources");
const {
    SemanticResourceAttributes,
} = require("@opentelemetry/semantic-conventions");

const opentelemetry = require("@opentelemetry/sdk-node");
const {
    getNodeAutoInstrumentations,
} = require("@opentelemetry/auto-instrumentations-node");

// Create a new instance of JaegerExporter with the options
const exporter = new JaegerExporter({
    serviceName: "YOUR-SERVICE-NAME",
    host: "localhost", // optional, can be set by OTEL_EXPORTER_JAEGER_AGENT_HOST
    port: 16686 // optional
});

const provider = new BasicTracerProvider({
    resource: new Resource({
        [SemanticResourceAttributes.SERVICE_NAME]:
            "YOUR-SERVICE-NAME",
    }),
});
// Add the JaegerExporter to the span processor
provider.addSpanProcessor(new SimpleSpanProcessor(exporter));

provider.register();
const sdk = new opentelemetry.NodeSDK({
    traceExporter: exporter,
    instrumentations: [getNodeAutoInstrumentations()],
});

sdk
    .start()
    .then(() => {
        console.log("Tracing initialized");
    })
    .catch((error) => console.log("Error initializing tracing", error));

process.on("SIGTERM", () => {
    sdk
        .shutdown()
        .then(() => console.log("Tracing terminated"))
        .catch((error) => console.log("Error terminating tracing", error))
        .finally(() => process.exit(0));
Here is a simple breakdown of the code:
The code starts by importing the modules
BasicTracerProviderandSimpleSpanProcessorfor setting up tracing from the OpenTelemetry libraryIt then imports the JaegerExporter module for exporting trace data to Jaeger.
The code creates a new instance of the JaegerExporter, specifying the service name, host, and port.
It then creates a
BasicTracerProviderand adds the JaegerExporter to the span processor usingSimpleSpanProcessor.The provider is registered, setting it as the default provider for the application.
An OpenTelemetry SDK instance is created, configuring it with the JaegerExporter and enabling auto-instrumentations for Node.js.
The OpenTelemetry SDK is started, initializing tracing.
A handler for the SIGTERM signal is set up to shut down tracing when the application is terminated.
The code then configures the trace provider with a trace exporter. To verify the instrumentation,
ConsoleSpanExporteris used to print some of the tracer output to the console.
How to Set Up OpenTelemetry to Export the Traces
Next, you'll need to write the configurations to collect and export data in the OpenTelemetry Collector.
Create a file config.yaml:
receivers:
  otlp:
    protocols:
      grpc:
      http:

exporters:
  datadog:
    api: # Replace with your Datadog API key
      key: "<YOUR_DATADOG_API_KEY>"
    # Optional:
    #   - endpoint: https://app.datadoghq.eu  # For EU region

processors:
  batch:

extensions:
  pprof:
    endpoint: :1777
  zpages:
    endpoint: :55679
  health_check:

service:
  extensions: [health_check, pprof, zpages]
  pipelines:
    traces:
      receivers: [otlp]
      processors: [batch]
      exporters: [datadog]
The configuration sets up OpenTelemetry with the OTLP (OpenTelemetry Protocol) receiver and the Datadog exporter. Here’s a break down of the code:
receivers: Specifies the components that receive the telemetry data. In this case, it includes the OTLP receiver, which supports both gRPC and HTTP protocols.exporters: Defines the components responsible for exporting telemetry data. Here, it configures the Datadog exporter, providing the Datadog API key. Additionally, an optionalendpointis provided for using Datadog's EU region.processors: Specifies the data processing components. In this case, thebatchprocessor is used to batch and send data in larger chunks for efficiency.extensions: Defines additional components that extend the functionality. Here, it includes extensions for pprof (profiling data), zpages (debugging pages), and a health check extension.service: Configures the overall service behavior, including the extensions and pipelines. Theextensionssection lists the extensions to be used, and thepipelinessection configures the telemetry data pipeline. Here, the traces pipeline includes the OTLP receiver, the batch processor, and the Datadog exporter.
This code is configured by the collector with the Datadog exporter to send the traces to Datadog Distributed Tracing services. However, there are other distributed tracing services that you can use like New Relic, Logzio, and Zipkin.
How to Start the Application
After correctly setting up auto-instrumentation, start the application again to test and verify the tracing configuration.
Begin by starting the OpenTelemetry Collector:
./otelcontribcol_darwin_amd64 --config ./config.yaml
The collector will start on port 4317.
Next, go to the directory of the first service:
$ cd <ServiceA>
Then start the first service with the “--require './tracer.js'” parameter to enable the application instrumentation.
$ node --require './tracer.js' index.js
Repeat this to start the second service.
Using a browser like Chrome, go to the endpoints of your two applications' services, add some data, and send some requests to test the tracing configuration.
Once the requests are made, these traces are picked up by the collector, which then dispatches them to the distributed tracing backend specified by the exporter configuration in the collector's configuration file.
It's worth noting that our tracer not only facilitates the transmission of traces to the designated backend, but also exports them to the console at the same time.
This dual functionality allows for real-time visibility into the traces being generated and sent, helping us in the monitoring and debugging processes.
Now, let’s use Jaeger UI to monitor the traces:
Start Jaeger with the following command:
docker run -d --name jaeger \
  -e COLLECTOR_ZIPKIN_HOST_PORT=:9411 \
  -p 5775:5775/udp \
  -p 6831:6831/udp \
  -p 6832:6832/udp \
  -p 5778:5778 \
  -p 16686:16686 \
  -p 14250:14250 \
  -p 14268:14268 \
  -p 14269:14269 \
  -p 9411:9411 \
  jaegertracing/all-in-one:1.32
Using a browser, start Jaeger UI at the http://localhost:16686/ endpoint.

There you have it! The initiation of the trace starting from the inception point of one service, navigating through a sequence of operations.
This path is created as the service starts its operations, resulting in the set up of the other service to fulfill the original request you initiated earlier.
The trace provides a visual narrative of what happens between these services, offering insights into each step of the process.
How Can You Use Observability Data?
Monitoring Metrics: Keep an eye on key metrics such as response times, error rates, and resource usage. Sudden spikes or anomalies can indicate issues that require attention.
Logging: Log data provides detailed information about events and actions within a system. Analyzing logs helps in understanding the sequence of activities and tracing the steps leading to an issue.
Tracing: Tracing involves tracking the flow of requests or transactions across different components of a system. This helps in understanding the journey of a request and identifying any bottlenecks or delays.
Alerting: Set up alerts based on specific conditions or thresholds. When certain metrics exceed predefined limits, alerts can notify you in real-time, allowing for immediate action.
Visualization: Use graphical representations and dashboards to visualize complex data. This makes it easier to identify patterns, trends, and correlations in the observability data.
Observability, when implemented effectively, empowers teams to proactively manage and improve the performance, reliability, and user experience of their systems. It's a crucial aspect of modern software development and operations.
Conclusion
In this guide you learned how to auto-instrument Node.js applications with little code by:
Installing and configuring the OpenTelemetry Node.js SDK and the auto-instrumentation package
Enabling automatic tracing and metrics collection for your Node.js applications and their dependencies
Exporting to visualize your telemetry data on a backend, Jaeger.
Using OpenTelemetry’s auto-instrumentation can help you gain valuable insights into the performance and behavior of your Node.js applications without having to manually instrument each library or framework.