When you're working on a React project, one of the easiest ways to debug your code is using the React Dev Tools.
React Dev Tools is an extension created by the React team. It enables developers to debug their code inside their Developer Tools.
Once you add the extension, you will get 2 new tabs in DevTools called Components and Profiler, respectively.
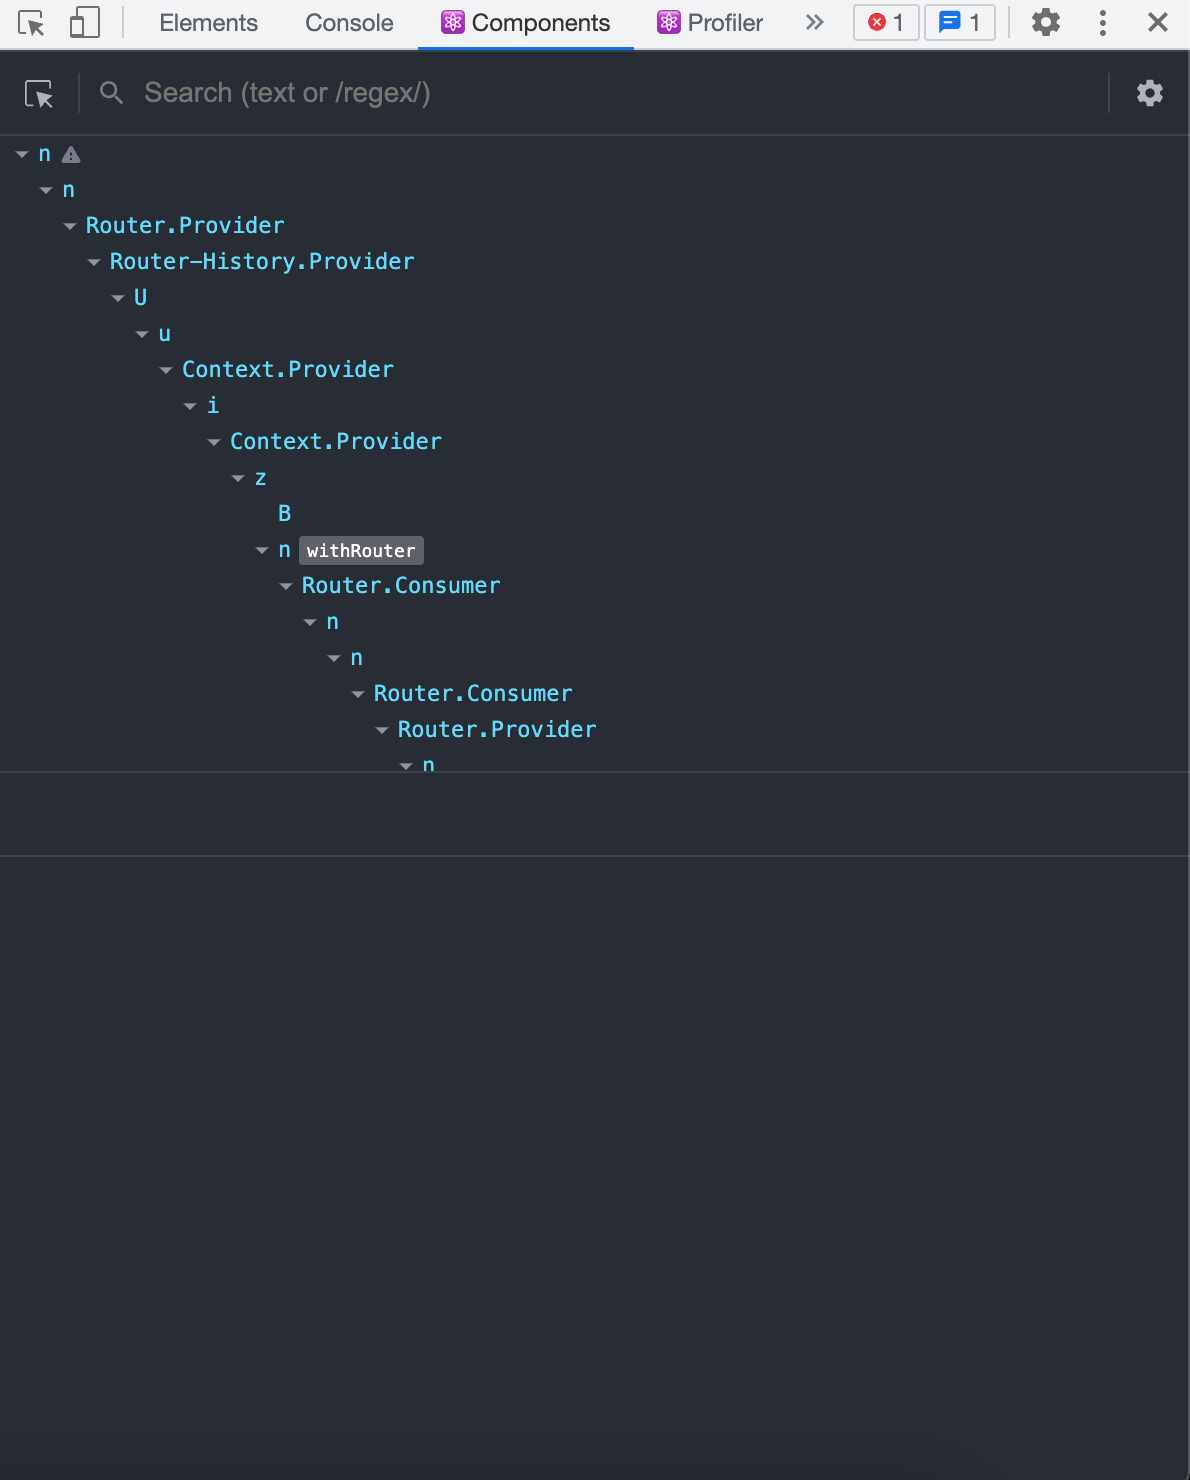
Components and Profiler tabs in Chrome Dev Tools
To use the full functionality of the extension, you need to be in development mode. This is because in production mode, the component names get changed to letters (as you can see in above screenshot) and you will not be able to profile your components.
How to Use the Components Tab
The Components tab allows you to debug your code in dev tools with various functionalities. Let's cover them one by one:
You can check the props/ state/ hooks of the component
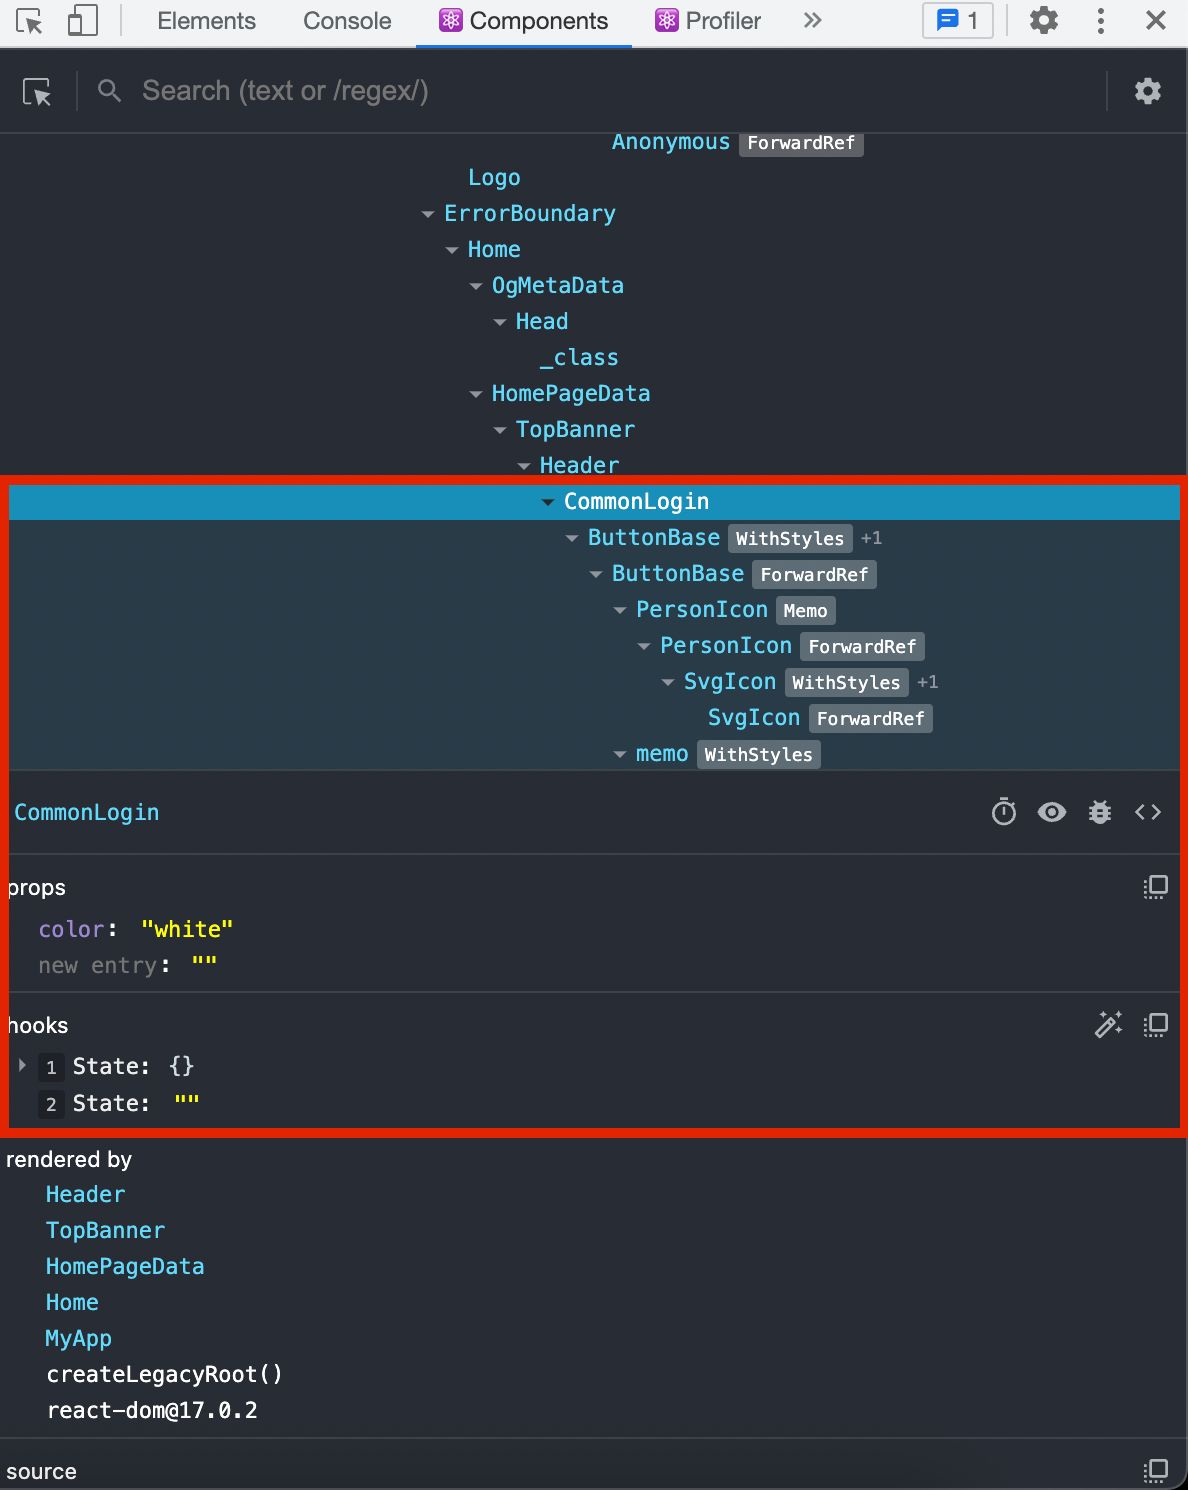
Viewing Props and State
This tab will help you to look for a component and check its respective props/ state in your dev tools, without having to log them in the console separately.
You can edit the props/ state from dev tools
One of the amazing features is that you can edit the props/ state of your component in the browser itself. This helps you to reflect changes in real time without having to reload or refresh your webpage. Above is a sample video so you can see how it works.
You can search for a component
You can easily search for a component within your whole application by just typing out the name in the search bar provided. It will show you all related components with the keywords typed in. Then you can navigate between the matching results.
You can check the component's tree
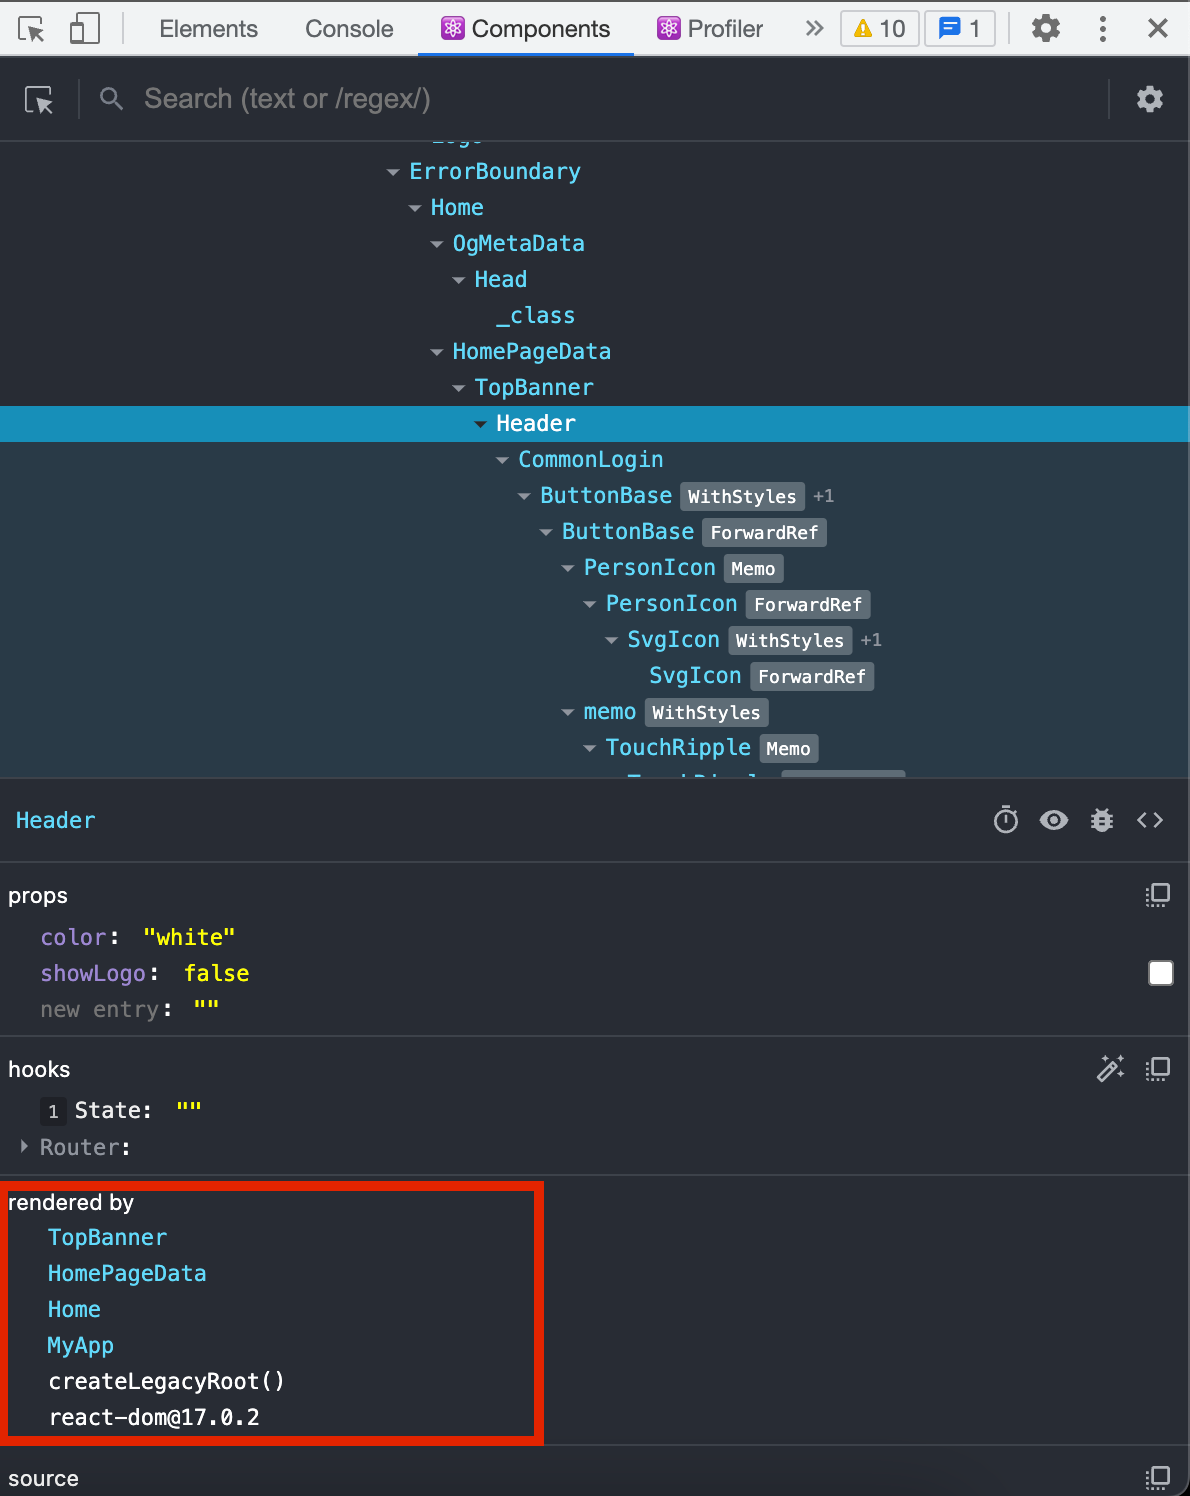
Component's Hierarchy
While debugging, its important to note which parent components caused the child component to re-render. Checking this in your code is sometimes tedious. But the "rendered by" section makes it easier for you by showing all the parent components in a single place.
You can log a component's data in the console

Logging a component's data in the console
There are developers who like to work in console, and this feature allows you to log all of your component's data to console with just one click. It shows all relevant information regarding the component like props received, hooks present, which node is it in the DOM, and the file's location in your system.
You can check subcomponents
Just like checking parent components isn't always easy in your code, the same applies with checking child components.
To overcome this issue, you can double click on a component name, which will show you all the subcomponents present inside the target component in one go.
How to Use the Profiler Tab
This tab allows you to test the performance of your components and shows which components to focus on for improvements.
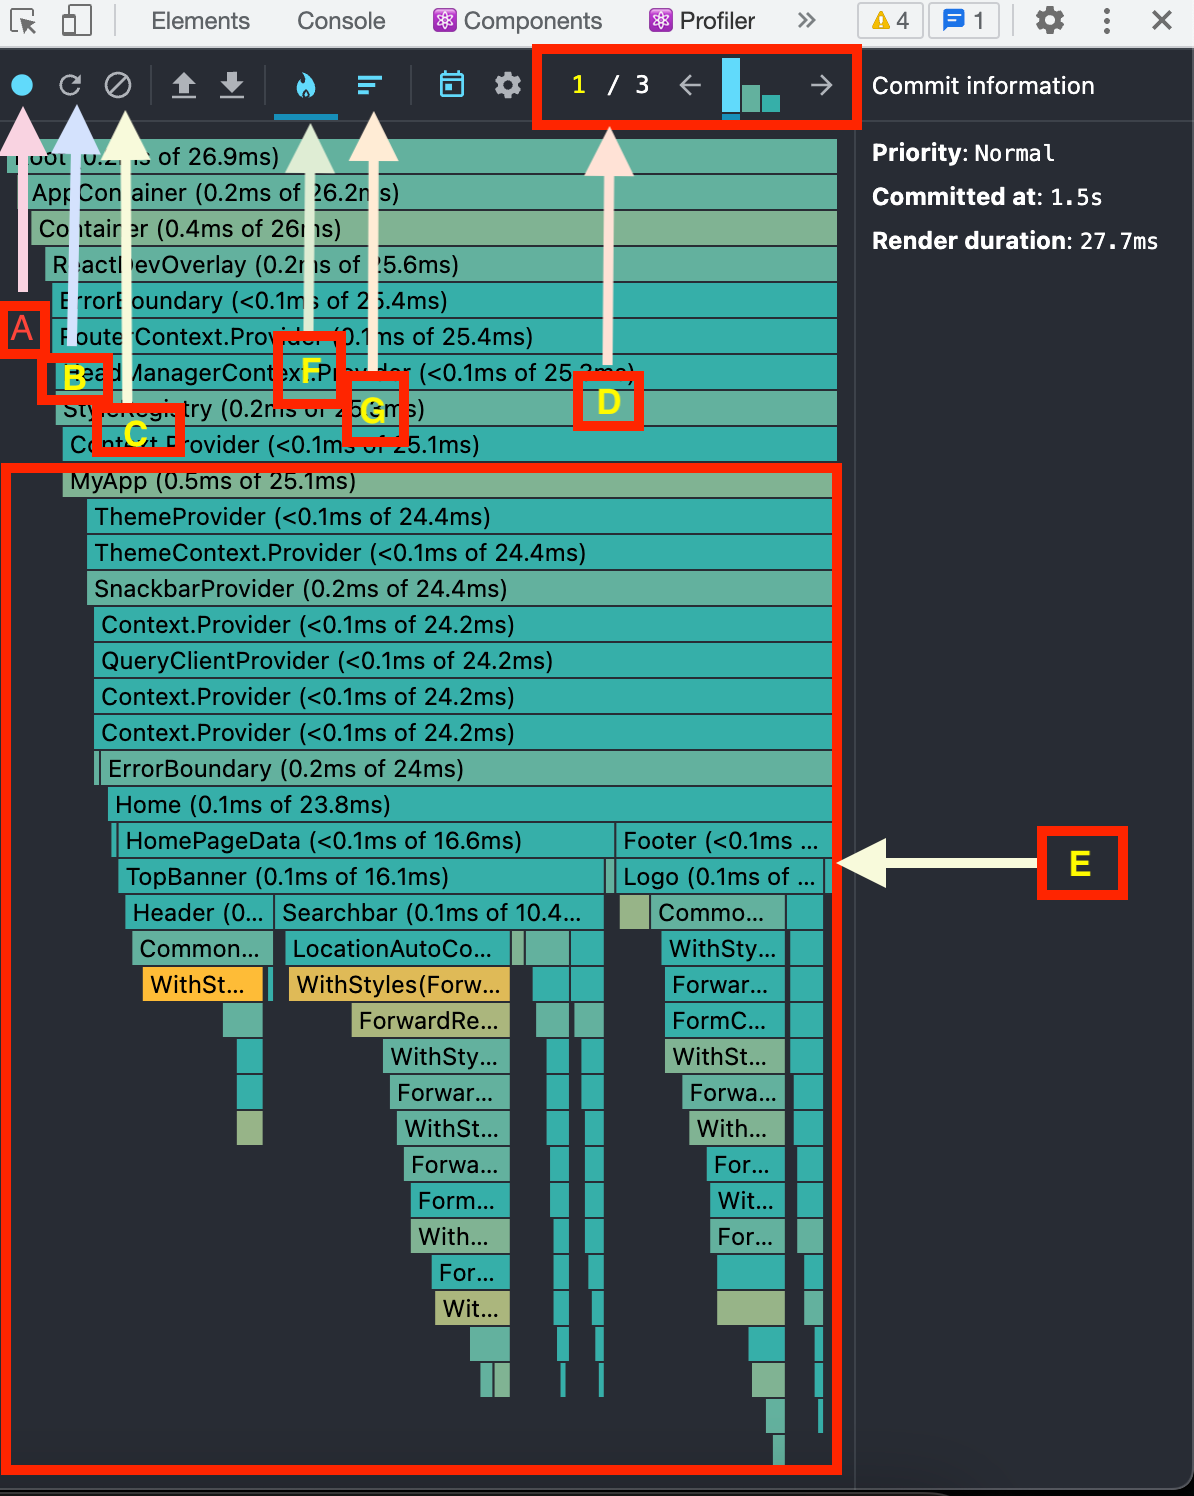
Profiler tab
As you can see above, I've marked a few things on the screenshot. Let's cover them one by one:
A is the record button, which will help you record a profiling session.
B is the refresh button, which will help you refresh the page for a session.
C is the clear button, which will help you clear the profiling session's result.
D is the commit chart, which will show you the list of commits during a session.
E is the component list, which will show you the components rendered during a session.
F is the flame chart button, which will show you the component list like E.
G is the ranked chart button, which will show you the component list in a ranked manner.
Now let's dive into different functionalities present in this tab and how to check the performance of your web page:
How to Read the Commit Chart
The commit chart shows the list of commits during a session. If you can see in the above image, in section D, there are 3 bars. These denote 3 commits in a session. And each commit shows a side effect that caused the DOM to update.
As per the docs, "The colour and height of each bar corresponds to how long that commit took to render. (Taller, yellow bars took longer than shorter, blue bars.)"
You can even navigate between the bars and check each commit separately.
How to Read the Flame Chart
Flame chart shows the list of components rendered in a commit. If you can see in the above image, when you click on the section labeled F, all horizontal bars in the section E represent different components of the 1st commit.
As per the docs, "The colour of a bar indicates how long the component (and its children) took to render in the selected commit. Yellow components took more time, blue components took less time, and gray components did not render at all during a commit."
How to Check the Performance of Your Web Page
To check the performance of your web page, all you need to do is:
Click on the record button.
Use your web page so that the Profiler will be able to analyse the rendering of components.
Click the record button again to finish recording.
Then you will see the flame chart, and you can analyse which components are taking more time to render.
Note that the flame chart also shows:
When exactly the component rendered.
And how long it took to render in a profiling session.
For example: In below image, the Home component was rendered at 1.5s of the profiling session and it took 27.7 ms to render.
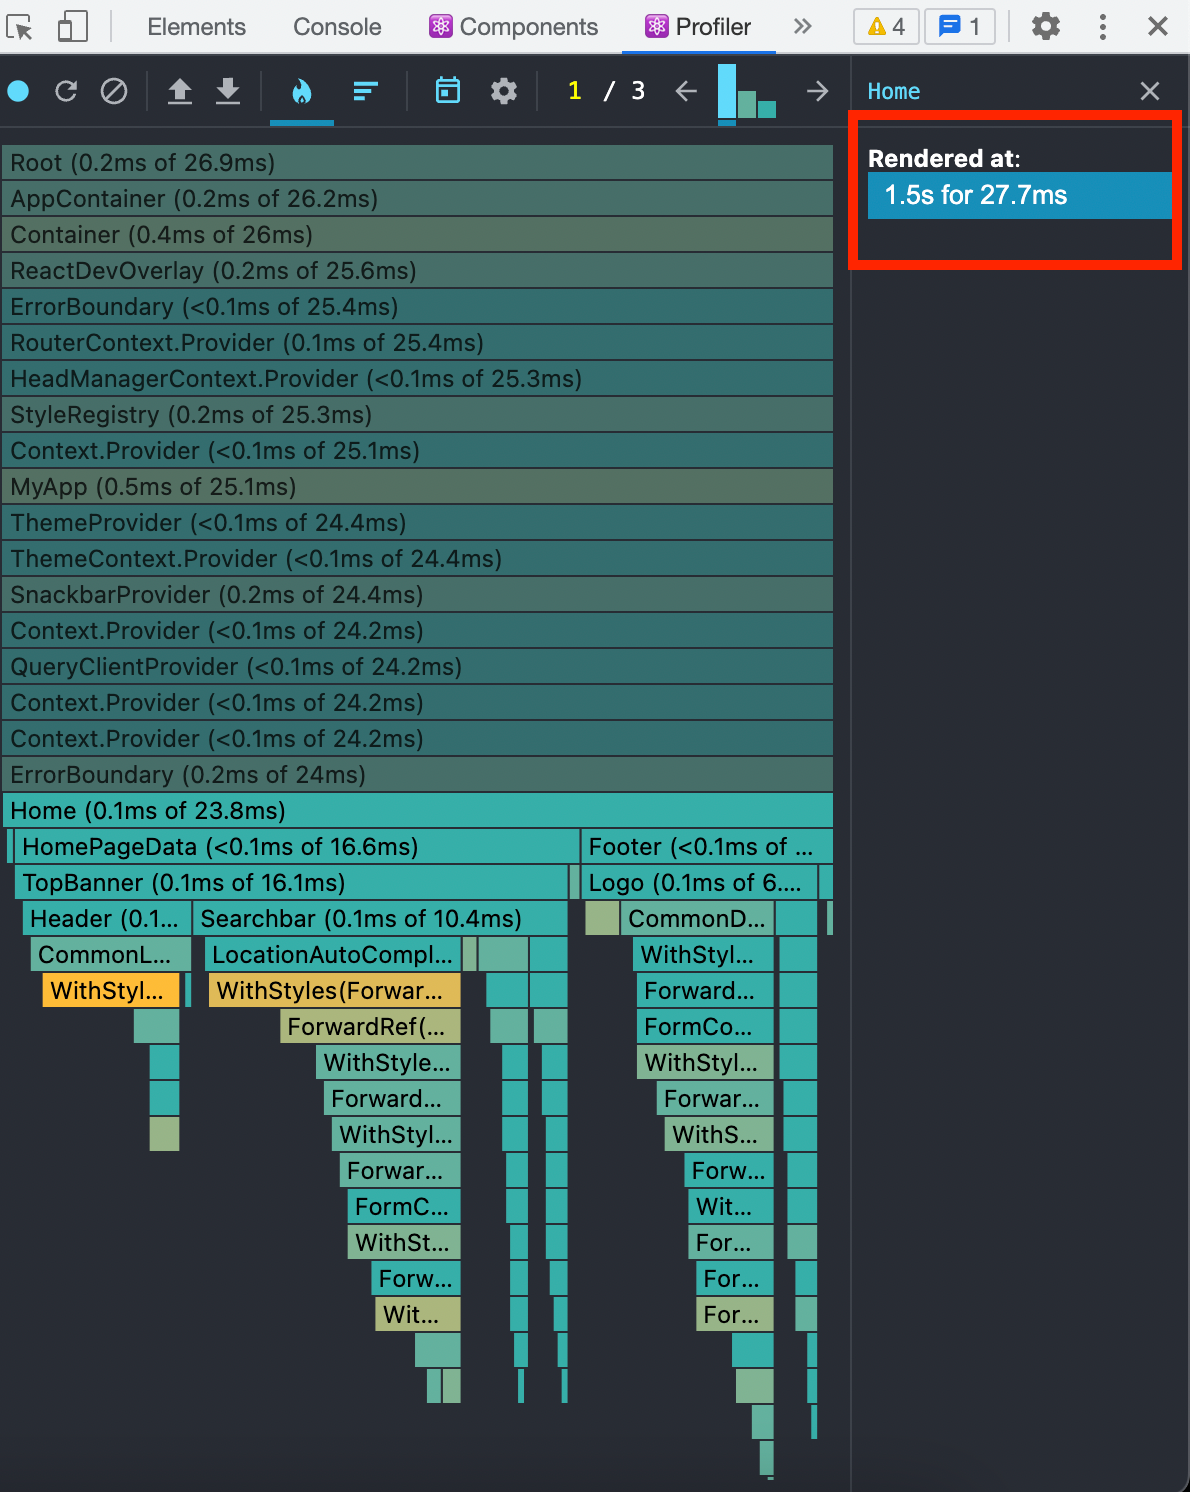
Flame Chart
How to Read a Ranked Chart
When you click the Ranked chart icon as shown in section G of the image, you will get a chart view of the components. This view is in descending order, that is the component that took the most time to render will be at the top and the component which took the least time will be at the bottom.
You can see this in the below image:
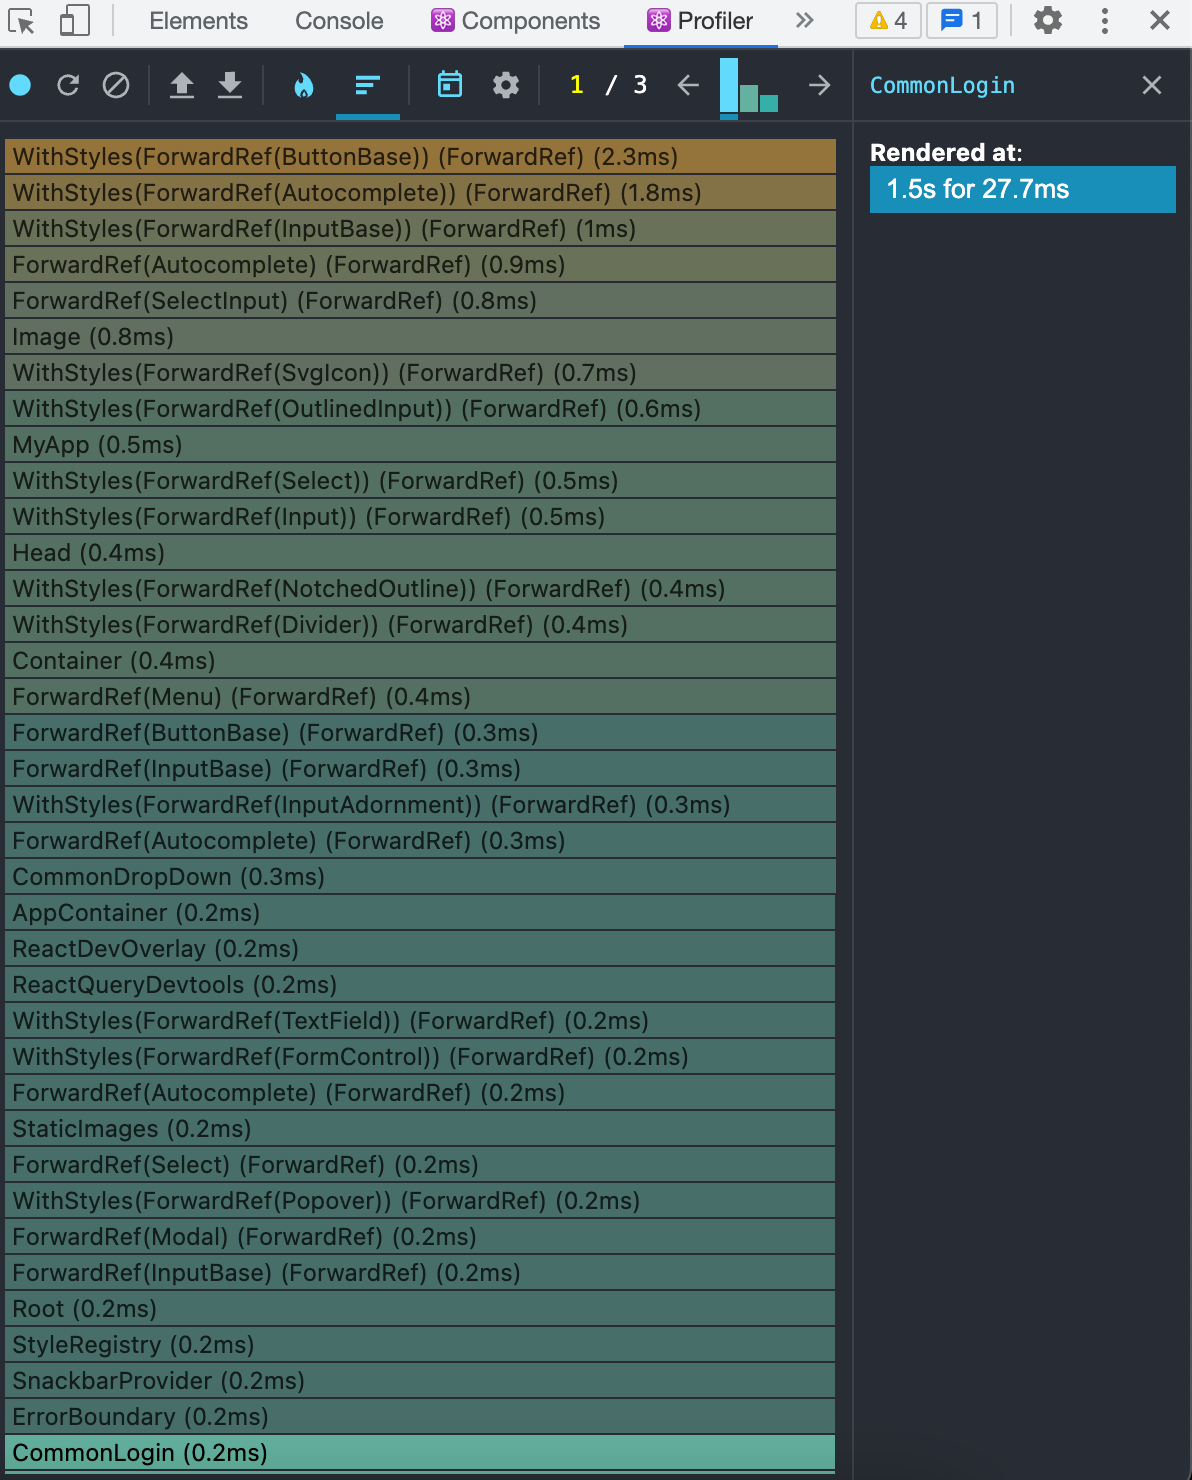
Ranked Chart
Note: You can get more information about why your component rendered by just enabling the "Record why each component rendered while profiling." checkbox in settings of the "Profiler" tab. I've attached an image for reference below:
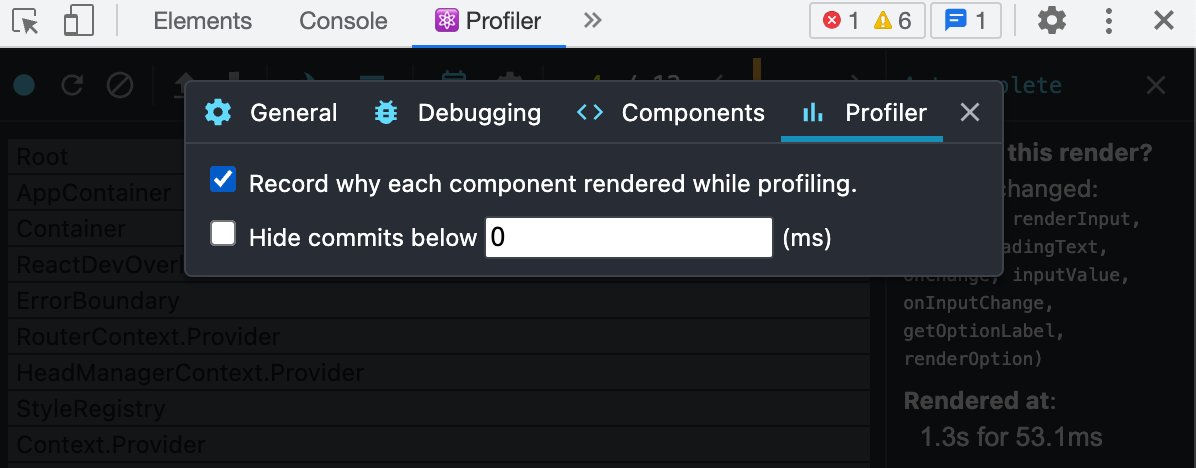
Render description
Conclusion
React Dev Tools is a great extension to have when you're working on your React applications. They can help you easily debug your code and find performance bottlenecks in your application.
Do try out these features next time in your React project.
Thanks for reading!
If you found this article useful, do share it with your friends and colleagues.
If you like to see similar tips and tricks in HTML, CSS, JavaScript and React, do Follow me on LinkedIn.
