By Sachin Malhotra
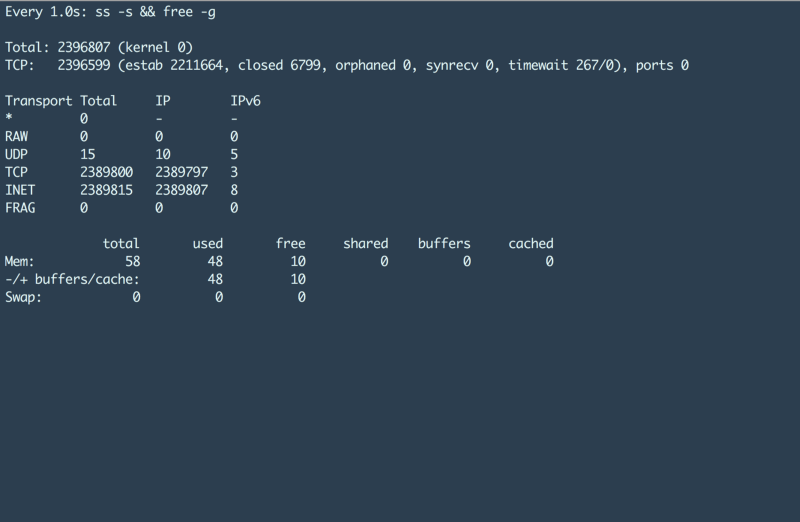
If you look at the above screenshot closely, you’ll find two important pieces of information:
- This machine has 2.38 million TCP connections established, and
- The amount of RAM being used is around 48 Gigabytes.
Pretty awesome right? What would be even more awesome is if someone provided the setup components, and the tunings required to achieve this kind of scale on a single HAProxy machine. Well, I’ll do just that in this post ;)
This is the final part of the multipart series on load testing HAProxy. If you have time, I recommend you go and read the first two parts in the series first. These will help you get the hang of the kernel level tunings required on all the machines in this setup.
Load Testing HAProxy (Part-1)
_Load Testing ? HAProxy ? If all this seems greek to you, don’t worry. I will provide inline links to read up on what…_medium.comLoad Testing HAProxy (Part 2)
_This is the second part in the 3 part series on performance testing of the famous TCP load balancer and reverse proxy…_medium.com
There are a lot of small components that helped us bring together the entire setup and achieve these numbers.
Before I tell you the final HAProxy configuration we used (if you’re super impatient you can scroll to the bottom) I want to build up to it by walking you through our thinking.
What we wanted to test
The component we want to test was HAProxy version 1.6. We are using this in production right now on 4 core, 30 Gig machines. However, all the connectivity is non-SSL based.
We wanted to test two things out of this exercise:
- The CPU percentage increase when we shift the entire load from non-SSL connections to SSL connections. The CPU usage should definitely increase, owing to the longer 5-way handshake and then the packet encryption.
- Secondly, we wanted to test the limits of our current production setup in terms of number of requests and the max number of concurrent connections that can be supported before performance starts to degrade.
We required the first part because of a major feature rollout that’s in full swing, which requires communication over SSL. We required the second part so that we could reduce the amount of hardware dedicated in production to HAProxy machines.
The Components Involved
- Multiple client machines to stress the HAProxy.
- Single HAProxy machine version 1.6 on various setups
- 4 core, 30 Gig
- 16 core, 30 Gig
- 16 core, 64 Gig
- Backend servers that will help support all these concurrent connections.
HTTP and MQTT
If you’ve gone through the first article in this series, you should know that our entire infrastructure is supported over two protocols:
- HTTP and
- MQTT.
In our stack, we don’t use HTTP 2.0 and hence don’t have the functionality of persistent connections on HTTP. So on production the max number of TCP connections that we see is somewhere around (2 * 150k) on a single HAProxy machine (Inbound + Outbound). Although the number of concurrent connections is rather low, the number of requests per second is quite high.
On the other hand, MQTT is a different way altogether for communication. It offers great quality of service parameters and persistent connectivity as well. So bidirectional continuous communication can happen over a MQTT channel. As for HAProxy that supports MQTT (underlying TCP) connections, we see somewhere around 600–700k TCP connections at the peak time on a single machine.
We wanted to do a load test that will give us precise results for both HTTP and MQTT based connections.
There are a lot of tools out there that help us load test an HTTP server easily and a lot of these tools provide advanced functionalities like summarized results, converting text based results to graphs, etc. We could not, however, find any stress testing tool for MQTT. We do have a tool that we developed ourselves, but it was not stable enough to support this kind of load in the timeframe we had.
So we decided to go for load testing clients for HTTP and simulating the MQTT setup using the same ;) Interesting right?
Well read on.
The Initial Setup
This is going to be a long post as I will be providing a lot of details that I think would be really helpful to someone doing similar load testing or fine tunings.
- We took a 16 core 30 Gig machine for setting up HAProxy initially. We did not go with our current production setup because we thought the CPU hit because of SSL termination happening at the HAProxy end would be tremendous.
- For the server end, we went with a simple NodeJs server that replies with
pongon receiving apingrequest. - As for the client, we ended up using Apache Bench initially. The reason we went with
abwas because it was a very well known and stable tool for load testing HTTP end points and also because it provides beautiful summarized results that would help us a lot.
The ab tool provides a lot of interesting parameters that we used for our load test like:
- c, concurrencySpecifies the number of concurrent requests that would hit the server.-n, no. of requestsAs the name suggests, specifies the total number of requests of the current load run.-p POST fileContains the body of the POST request (if that is what you want to test.)
If you look at these parameters closely, you will find that a lot of permutations are possible by tweaking all three. A sample ab request would look something like this
ab -S -p post_smaller.txt -T application/json -q -n 100000 -c 3000 http://test.haproxy.in:80/ping
A sample result of such a request looks something like this
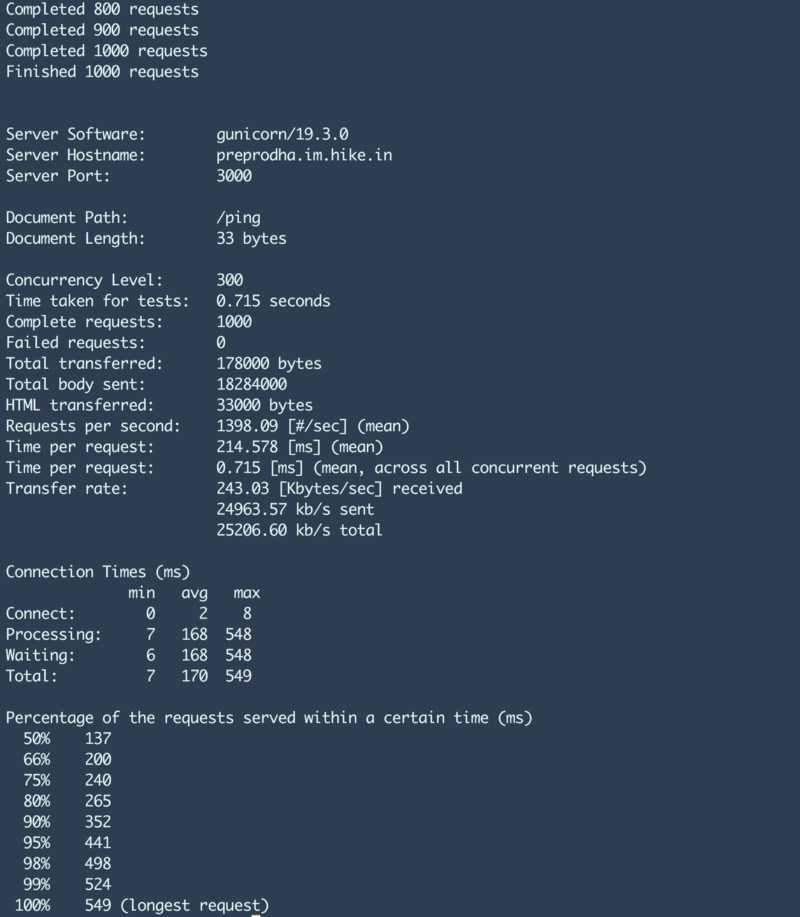
The numbers that we were interested in were
- 99% latency.
- Time per request.
- No. of failed requests.
- Requests per second.
The biggest problem of ab is that it does not provide a parameter to control the number of requests per second. We had to tweak the concurrency level to get our desired requests per second and this lead to a lot of trail and errors.
The Almighty Graph
We could not randomly go about doing multiple load runs and keep getting results because that would not give us any meaningful information. We had to perform these tests in some specific way so as to get meaningful results out of it. So we followed this graph
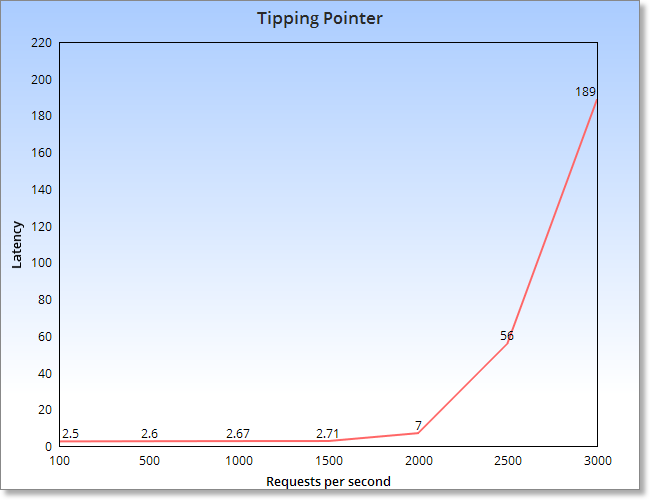
This graph states that up until a certain point, if we keep increasing the number of requests, the latency will remain almost the same. However, beyond a certain tipping point, the latency will start to increase exponentially. It is this tipping point for a machine or for a setup that we intended to measure.
Ganglia
Before providing some test results, I would like to mention Ganglia.
Ganglia is a scalable distributed monitoring system for high-performance computing systems such as clusters and Grids.
Look at the following screenshot of one of our machines to get an idea about what ganglia is and what sort of information it provides about the underlying machine.
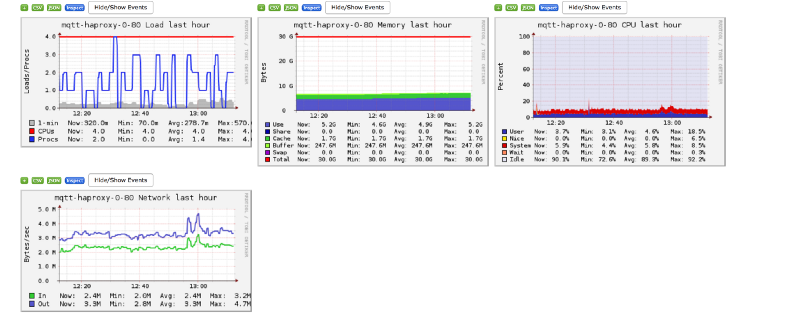
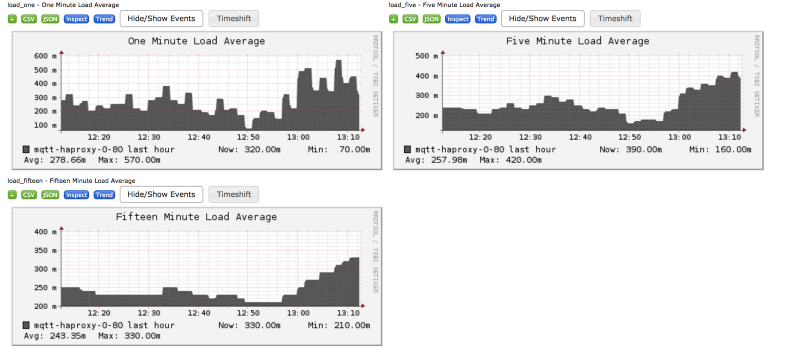
Pretty interesting, eh?
Moving on, we constantly monitored ganglia for our HAProxy machine to monitor some important things.
TCP establishedThis tells us the total number of tcp connections established on the system. NOTE: this is the sum of inbound as well as outbound connections.packets sent and receivedWe wanted to see the total number of tcp packets being sent and received by our HAProxy machine.bytes sent and receivedThis shows us the total data that we sent and received by the machine.memoryThe amount of RAM being used over time.networkThe network bandwidth consumption because of the packets being sent over the wire.
Following are the known limits found via previous tests/numbers that we wanted to achieve via our load test.
700k TCP established connections,
50k packets sent, 60k packets received,
10–15MB bytes sent as well as received,
14–15Gig memory at peak,
7MB network.ALL these values are on a per second basis
HAProxy Nbproc
Initially when we began load testing HAProxy, we found out that with SSL the CPU was being hit pretty early on in the process but the requests per second were very low. On investigating the top command, we found that HAProxy was using only 1 core. Whereas we had 15 more cores to spare.
Googling for about 10 minutes led us to find this interesting setting in HAProxy that lets HAProxy use multiple cores.
It’s called nbproc and to get a better hang of what it is and how to set it, check out this article:
http://blog.onefellow.com/post/82478335338/haproxy-mapping-process-to-cpu-core-for-maximum
Tuning this setting was the base of our load testing strategy moving forward. Because the ability to use multiple cores by HAProxy gave us the power to form multiple combinations for our load testing suite.
Load Testing with AB
When we had started out with our load testing journey, we were not clear on the things we should be measuring and what we need to achieve.
Initially we had only one goal in mind and that was to find the tipping point only by variation of all the below mentioned parameters.
I maintained a table of all the results for the various load tests that we gave. All in all I gave over 500 test runs to get to the ultimate result. As you can clearly see, there are a lot of moving parts to each and every test.
Single Client issues
We started seeing that the client was becoming bottleneck as we kept on increasing our requests per second. Apache bench uses a single core and from the documentation it is evident that it does not provide any feature for using multiple cores.
To run multiple clients efficiently we found an interesting linux utility called Parallel. As the name suggests, it helps you run multiple commands in parallel and utilises multiple cores. Exactly what we wanted.
Have a look at a sample command that runs multiple clients using parallel.
cat hosts.txt | parallel 'ab -S -p post_smaller.txt -T application/json -n 100000 -c 3000 {}'
sachinm@ip-192-168-0-124:~$ cat hosts.txthttp://test.haproxy.in:80/pinghttp://test.haproxy.in:80/pinghttp://test.haproxy.in:80/ping
The above command would run 3 ab clients hitting the same URL. This helped us remove the client side bottleneck.
The Sleep and Times parameter
We talked about some parameters in ganglia that we wanted to track. Lets discuss them once by one.
packets sent and receivedThis can be simulated by sending some data as a part of the post request. This would also help us generate somenetwork as well as bytes sent and received portions in gangliatcp_establishedThis is something which took us a long, long time to actually simulate in our scenario. Imagine if a single ping request takes about a second, that would take us about 700k requests per second to reach our tcp_established milestone.
Now this number might seem easier to achieve on production, but it was impossible to generate it in our scenario.
What did we do you might ask? We introduced a sleep parameter in our POST call that specifies the number of milliseconds the server needs to sleep before sending out a response. This would simulate a long running request on production. So now say we have a sleep of about 20 minutes (Yep), that would take us around 583 requests per second to reach the 700k mark.
Additionally, we also introduced another parameter in our POST calls to the HAProxy and that was the times parameter. That specified number of times the server should write a response on the tcp connection before terminating it. This helped us simulated even more data transferred over the wire.
Issues with apache bench
Although we found out a lot of results with apache bench, we also faced a lot of issues along the way. I won’t be mentioning all of them here as they are not important for this post as I’ll be introducing another client shortly.
We were pretty content with the numbers we were getting out of apache bench, but at one point of time, generating the required tcp connections just became impossible. Somehow the apache bench was not handling the sleep parameter we had introduced, properly and was not scaling for us.
Although running multiple ab clients on a single machine was sorted out by using the parallel utility. Running this setup across multiple client machines was still a pain for us. I had not heard of the pdsh utility by then and was practically stuck.
Also, we were not focussing on any timeouts as well. There are some default set of timeouts on the HAProxy, the ab client and the server and we had completely ignored these. We figured out a lot of things along the way and organized ourselves a lot on how to go about testing.
We used to talk about the tipping point graph but we deviated a lot from it as time went on. Meaningful results, however, could only be found by focusing on that.
With apache bench a point came where the number of TCP connections were not increasing. We had around 40–45 clients running on 5–6 different client boxes but were not able to achieve the scale we wanted. Theoretically, the number of TCP connections should have jumped as we went on increasing the sleep time, but it wasn’t working for us.
Enter Vegeta

I was searching for some other load testing tools that might be more scalable and better functionality wise as compared to apache bench when I came across Vegeta.
From my personal experience, I have seen Vegeta to be extremely scalable and provides much better functionality as compared to apache bench. A single Vegeta client was able to produce the level of throughput equivalent to 15 apache bench clients in our load test.
Moving forward, I will be providing load test results that have been tested using Vegeta itself.
Load Testing with Vegeta
First, have a look at the command that we used to run a single Vegeta client. Interestingly, the command to put load on the backend servers is called attack :p
echo "POST https://test.haproxy.in:443/ping" | vegeta -cpus=32 attack -duration=10m -header="sleep:30000" -body=post_smaller.txt -rate=2000 -workers=500 | tee reports.bin | vegeta report
Just love the parameters provided by Vegeta. Let’s have a look at some of these below.
-cpus=32Specifies the number of cores to be used by this client. We had to expand our client machines to 32core, 64Gig because of the amount of load to be generated. If you look closely above, the rate isn’t much. But it becomes difficult to sustain such a load when a lot of connections are in sleep state from the server end.-duration=10mI guess this is self explanatory. If you don’t specify any duration, the test will run forever.-rate=2000The number of requests per second.
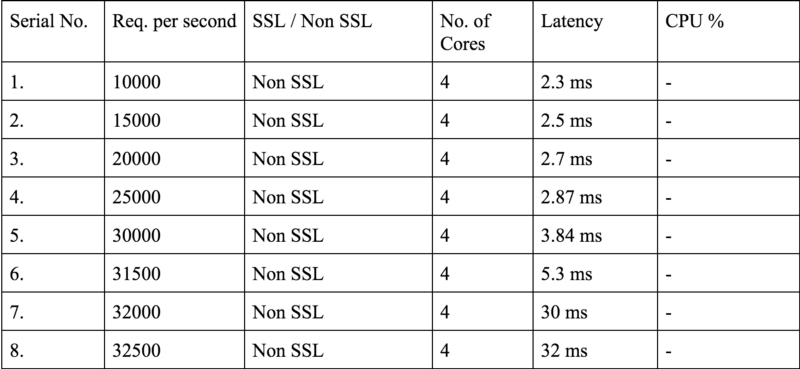
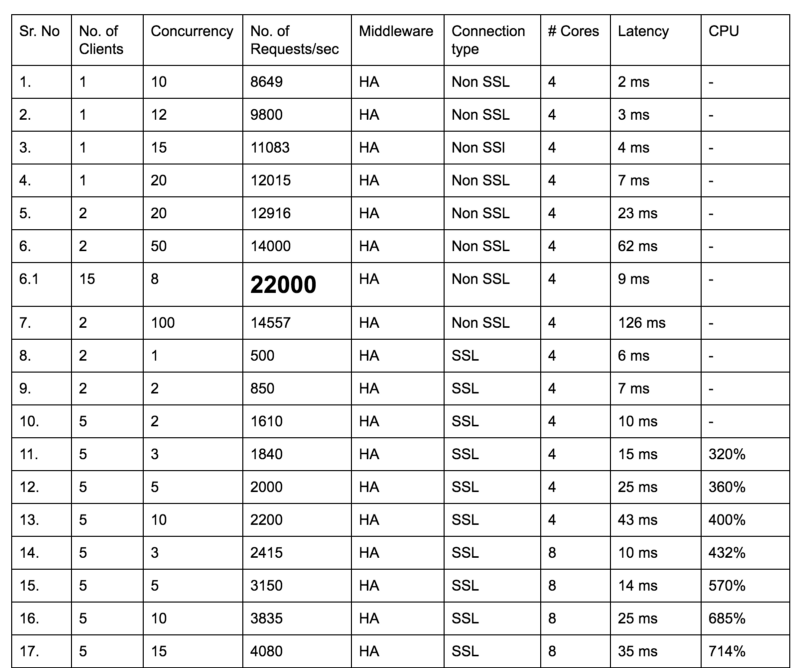
So as you can see above, we reached a hefty 32k requests per second on a mere 4 core machine. If you remember the tipping point graph, you will be able to notice it clearly enough above. So the tipping point in this case is 31.5k Non SSL requests.
Have a look at some more results from the load test.
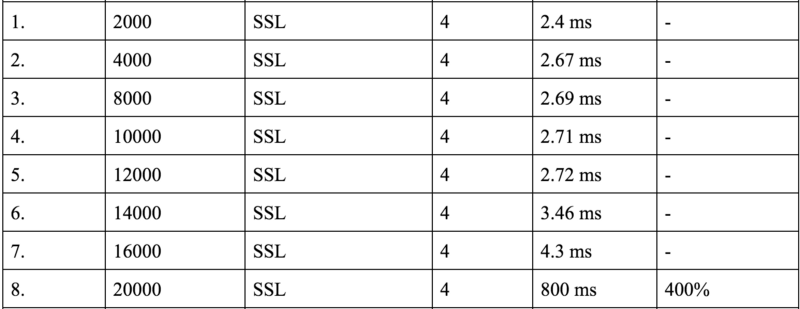
16k SSL connections is also not bad at all. Please note that at this point in our load testing journey, we had to start from scratch because we had adopted a new client and it was giving us way better results than ab. So we had to do a lot of stuff again.
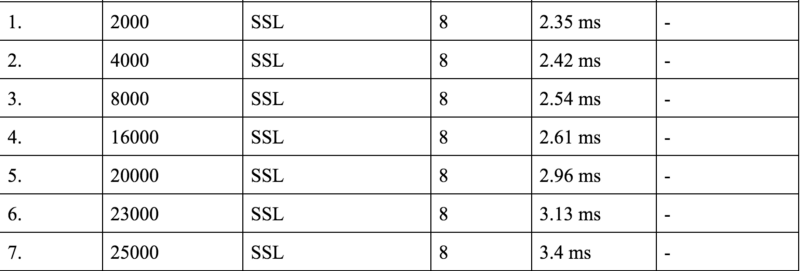
An increase in the number of cores led to an increase in the number of requests per second that the machine can take before the CPU limit is hit.
We found that there wasn’t a substantial increase in the number of requests per second if we increased the number of cores from 8 to 16. Also, if we finally decided to go with a 8 core machine in production, we would never allocate all of the cores to HAProxy or be it a any other process for that matter. So we decided to perform some tests with 6 cores as well to see if we had acceptable numbers.

Not bad.
Introducing the sleep
We were pretty satisfied with our load test results till now. However, this did not simulate the real production scenario. That happened when we introduced a sleep time as well which was absent till now in our tests.
echo "POST https://test.haproxy.in:443/ping" | vegeta -cpus=32 attack -duration=10m -header="sleep:1000" -body=post_smaller.txt-rate=2000 -workers=500 | tee reports.bin | vegeta report
So a sleep time of 1000 milliseconds would lead to server sleeping for x amount of time where 0< x <; 1000 and is selected randomly. So on an average the above load test will give a latency of ≥ 500ms
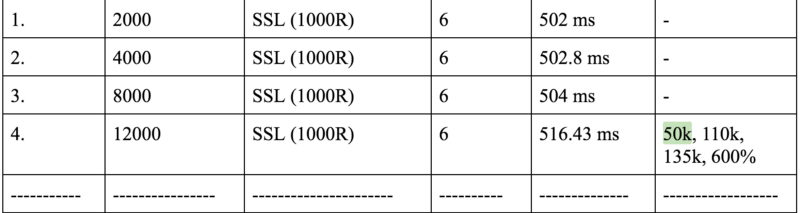
The numbers in the last cell represent
TCP established, Packets Rec, Packets Sent
respectively. As you can clearly see the max requests per second that the 6 core machine can support has decreased to 8k from 20k. Clearly, the sleep has its impact and that impact is the increase in the number of TCP connections established. This is however nowhere near to the 700k mark that we set out to achieve.
Milestone #1
How do we increase the number of TCP connections? Simple, we keep on increasing the sleep time and they should rise. We kept playing around with the sleep time and we stopped at the 60 seconds sleep time. That would mean an average latency of around 30 sec.
There is an interesting result parameter that Vegeta provides and that is % of requests successful. We saw that with the above sleep time, only 50% of the calls were succeeding. See the results below.
We achieved a whooping 400k TCP established connections with 8k requests per second and 60000 ms sleep time. The R in 60000R means Random.
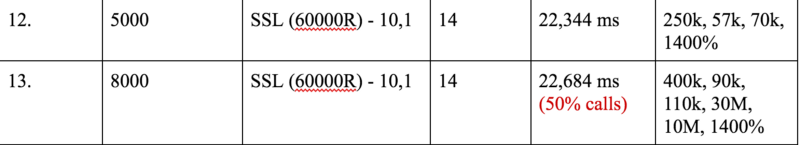
The first real discovery we made was that there is a default call timeout in Vegeta which is of 30 seconds and that explained why 50% of our calls were failing. So we increased that to about 70s for our further tests and kept on varying it as and when the need arose.
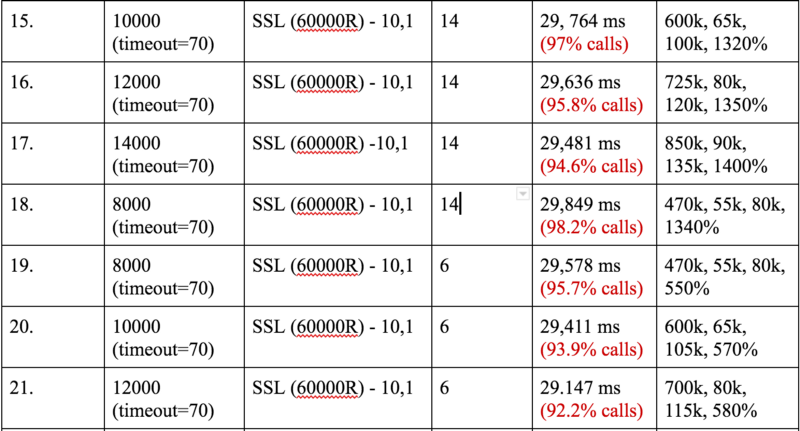
We hit the 700k mark easily after tweaking the timeout value from the client end. The only problem with this was that these were not consistent. These were just peaks. So the system hit a peak of 600k or 700k but did not stay there for very long.
We however wanted something similar to this
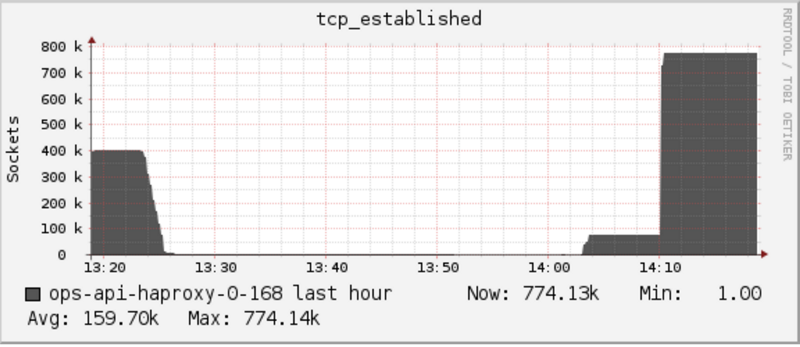
This shows a stable state where 780k connections are maintained. If you look closely at the stats above, the number of requests per second are very high. On production however, we have much less number of requests (somewhere around 300) on a single HAProxy machine.
We were sure that if we drastically reduced the number of HAProxies we have on production (somewhere around 30, which means 30*300 ~ 9k connects per second) we will hit the machine limits w.r.t. the number of TCP connections first and not the CPU.
So we decided to achieve 900 requests per second and 30MB/s Network and 2.1Million TCP established connections. We agreed upon these numbers as these would be 3 times our production load on a single HAProxy.
Plus, till now we had settled on 6 cores being used by HAProxy. We wanted to test out 3 cores only because this is what would be easiest for us to roll out on our production machines (Our production machines, as mentioned before are 4 core 30 Gig. So for rolling out changes with nbproc = 3 would be easiest for us.
REMEMBER the machine we had at this point in time was 16 core 30 Gig machine with 3 cores being allocated to HAProxy.
Milestone #2
Now that we had max limits on requests per second that different variations in machine configuration could support, we only had one task left as mentioned above.
Achieve 3X the production load which is
- 900 requests per second
- 2.1 million TCP established and
- 30 MB/s network.
We got stuck yet again as the TCP established were taking a hard hit at 220k. No matter what the number of client machines or what the sleep time was, number of TCP connections seemed to have stuck there.
Let’s look at some calculations. 220k TCP established connections and 900 requests per second = 110,000 / 900 ~= 120 seconds .I took 110k because 220k connections include both incoming and outgoing. So it’s two way.
Our doubt about 2 minutes being a limit somewhere in the system was verified when we introduced logs on the HAProxy side. We could see 120000 ms as total time for a lot of connections in the logs.
Mar 23 13:24:24 localhost haproxy[53750]: 172.168.0.232:48380 [23/Mar/2017:13:22:22.686] api~ api-backend/http31 39/0/2062/-1/122101 -1 0 - - SD-- 1714/1714/1678/35/0 0/0 {0,"",""} "POST /ping HTTP/1.1"
122101 is the timeout value. See HAProxy documentation on meanings of all these values.
On investigating further we found out that NodeJs has a default request timeout of 2 minutes. Voila !

how to modify the nodejs request default timeout time?
_I was using nodejs request, the default timeout of nodejs http is 120000 ms, but it is not enough for me, while my…_stackoverflow.comHTTP | Node.js v7.8.0 Documentation
_The HTTP interfaces in Node.js are designed to support many features of the protocol which have been traditionally…_nodejs.org
But our happiness was apparently short lived. At 1.3 million, the HAProxy connections suddenly dropped to 0 and started increasing again. We soon checked the dmesg command that provided us some useful kernel level information for our HAProxy process.
Basically, the HAProxy process had gone out of memory. So we decided to increase the machine RAM and we shifted to 16 core 64 Gig machine with nbproc = 3 and because of this change we were able to reach 2.4 million connections.
Backend Code
Following is the backend server code that was being used. We had also used statsd in the server code to get consolidated data on requests per second that were being received by the client.
var http = require('http');var createStatsd = require('uber-statsd-client');qs = require('querystring');
var sdc = createStatsd({host: '172.168.0.134',port: 8125});
var argv = process.argv;var port = argv[2];
function randomIntInc (low, high){ return Math.floor(Math.random() * (high - low + 1) + low);}
function sendResponse(res,times, old_sleep){ res.write('pong'); if(times==0) { res.end(); } else { sleep = randomIntInc(0, old_sleep+1); setTimeout(sendResponse, sleep, res,times-1, old_sleep); }}
var server = http.createServer(function(req, res){ headers = req.headers; old_sleep = parseInt(headers["sleep"]); times = headers["times"] || 0; sleep = randomIntInc(0, old_sleep+1); console.log(sleep); sdc.increment("ssl.server.http"); res.writeHead(200); setTimeout(sendResponse, sleep, res, times, old_sleep)
});
server.timeout = 3600000;server.listen(port);
We also had a small script to run multiple backend servers. We had 8 machines with 10 backend servers EACH (yeah !). We literally took the idea of clients and backend servers being infinite for the load test, seriously.
counter=0while [ $counter -le 9 ]do port=$((8282+$counter)) nodejs /opt/local/share/test-tools/HikeCLI/nodeclient/httpserver.js $port & echo "Server created on port " $port
((counter++))done
echo "Created all servers"
Client Code
As for the client, there was a limitation of 63k TCP connections per IP. If you are not sure about this concept, please refer my previous article in this series.
So in order to achieve 2.4 million connections (two sided which is 1.2 million from the client machines), we needed somewhere around 20 machines. Its a pain really to run the Vegeta command on all 20 machines one by one and even of you found a way to do that using something like csshx, you still would need something to combine all the results from all the Vegeta clients.
Check out the script below.
result_file=$1
declare -a machines=("172.168.0.138" "172.168.0.141" "172.168.0.142" "172.168.0.18" "172.168.0.5" "172.168.0.122" "172.168.0.123" "172.168.0.124" "172.168.0.232" " 172.168.0.244" "172.168.0.170" "172.168.0.179" "172.168.0.59" "172.168.0.68" "172.168.0.137" "172.168.0.155" "172.168.0.154" "172.168.0.45" "172.168.0.136" "172.168.0.143")
bins=""commas=""
for i in "${machines[@]}"; do bins=$bins","$i".bin"; commas=$commas","$i; done;
bins=${bins:1}commas=${commas:1}
pdsh -b -w "$commas" 'echo "POST http://test.haproxy.in:80/ping" | /home/sachinm/.linuxbrew/bin/vegeta -cpus=32 attack -connections=1000000 -header="sleep:20" -header="times:2" -body=post_smaller.txt -timeout=2h -rate=3000 -workers=500 > ' $result_file
for i in "${machines[@]}"; do scp sachinm@$i:/home/sachinm/$result_file $i.bin ; done;
vegeta report -inputs="$bins"
Apparently, Vegeta provides information on this utility called pdsh that lets you run a command concurrently on multiple machines remotely . Additionally, the Vegeta allows us to combine multiple results into one and that’s really all we wanted.
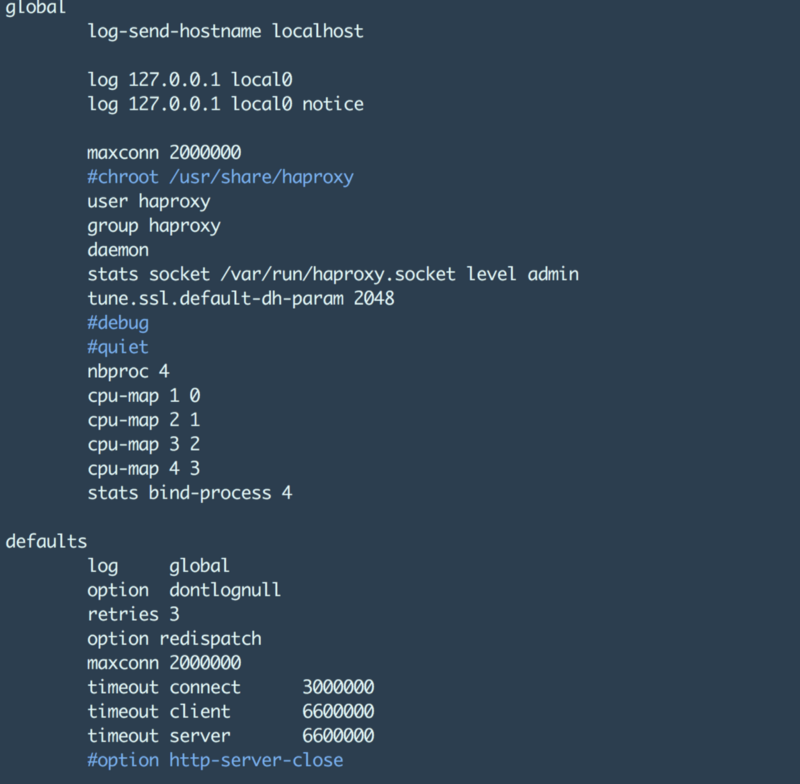
HAProxy Configuration
This is probably what you came here looking for, below is the HAProxy config that we used in our load test runs. The most important part being that of the nbproc setting and the maxconn setting. The maxconn setting allows us to provide the maximum number of TCP connections that the HAProxy can support overall (one way).
Changes to maxconn setting leads to increase in HAProxy process’ ulimit. Take a look below
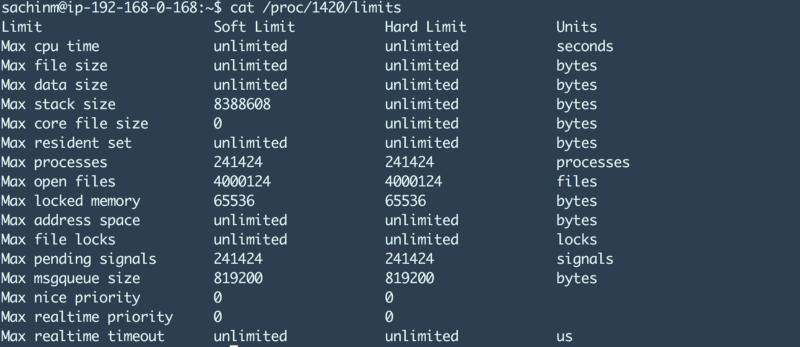
The max open files has increased to 4 million because of the max connections for HAProxy being set at 2 million. Neat !
Check the article below for a whole lot of HAProxy optimisations that you can and should do to achieve the kind of stats we achieved.
Use HAProxy to load balance 300k concurrent tcp socket connections: Port Exhaustion, Keep-alive and…
_I'm trying to build up a push system recently. To increase the scalability of the system, the best practice is to make…_www.linangran.com
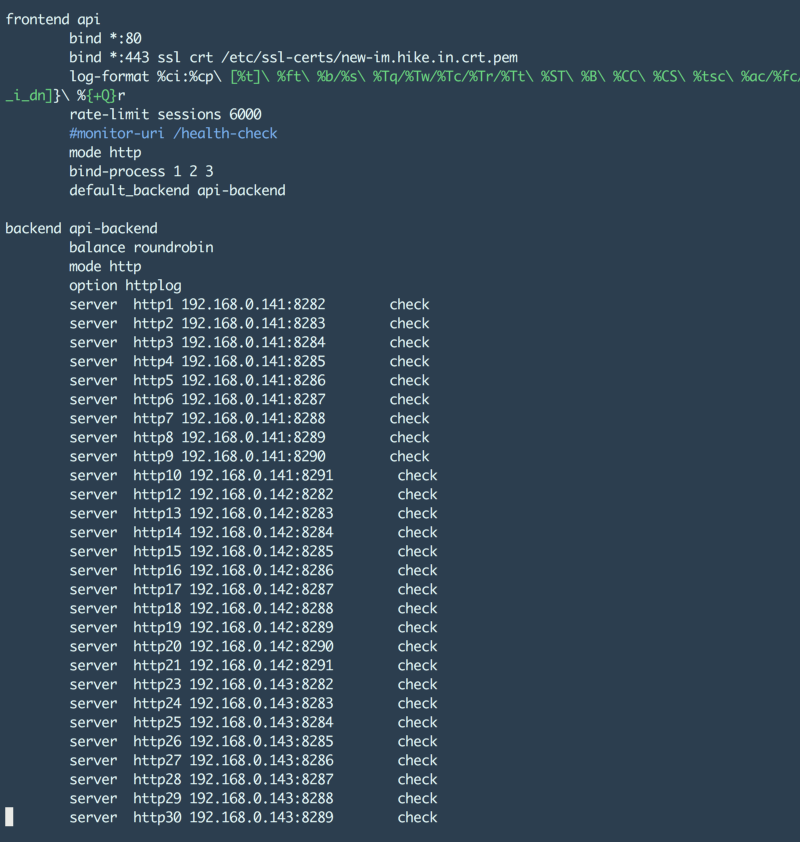
The http30 goes on to http83 :p
That’s all for now folks. If you’ve it so far, I’m truly amazed :)
A special shout out to Dheeraj Kumar Sidana who helped us all the way through this and without whose help we would not have been able to reach any meaningful results. :)
Do let me know how this blog post helped you. Also, please recommend (❤) and spread the love as much as possible for this post if you think this might be useful for someone.