By Rohit Arya
Like any other startup momentum-obsessed startup, we didn’t spend a lot of time to building an efficient product on the first go. We shipped our Android app, and it was working “just fine.”
As we started scaling up in terms of our offering to the customers, our app became bulky — with tons of images — and we started to see performance issues. Our app became slow and froze on low-end devices. Battery consumption also increased.
To debug this issue, we used a memory monitoring tool provided by Android Studio. As we scrolled through a very long list of product images, this is what we observed:
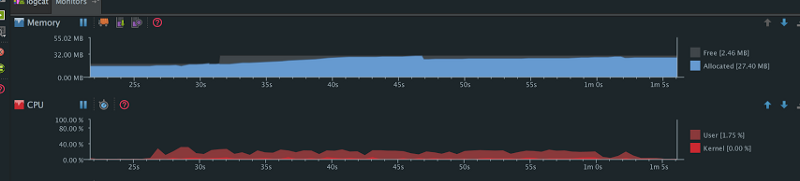
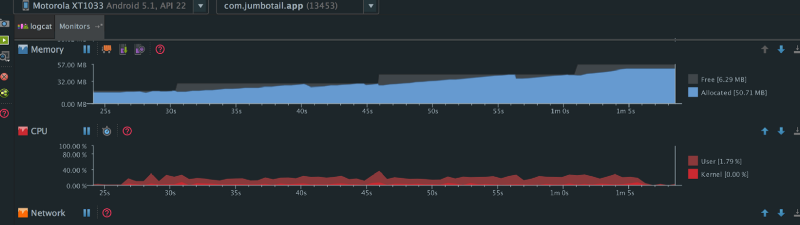 The Jumbotail Android app’s memory usage over time
To explain these graphs a little better:
- The sudden drop in the allocated memory is due to Garbage Collection (GC) events.
- The size of free memory increases when an Android kills other apps’ processes (which are in the background) to allocate more memory to the foreground app.
- CPU usage increased when we scrolled through the list of products.
Just by opening the product list page, the app consumed 15 megabytes of memory. If we scrolled all the way to the bottom of the product list page, the app consumed 50 megabytes of memory, with a lot of GC events.
When scrolling through other product lists we observed similar patterns. Here are the graphs:
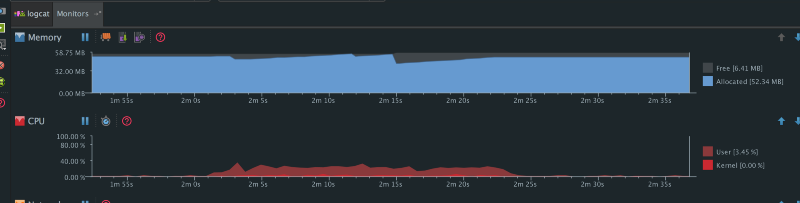 Pic 2: Memory usage over time
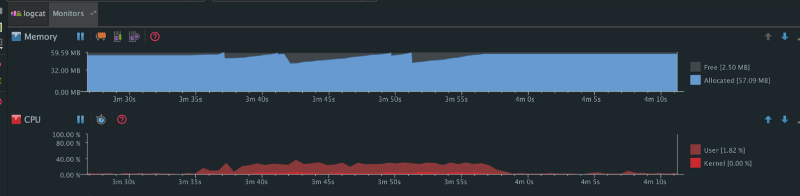 Pic 3: Memory usage over time
Again we observed this pattern. By this time Android had allocated maximum memory (for bitmaps) — which it could have allocated to our app by killing other apps’ processes in the background — and the net memory allocation has hit 57 megabytes along with several GC events.
These graphs are from the Android runtime. Dalvik behaves even worse in terms of memory management and Garbage Collection.
In Android, bitmaps represent the largest contiguous blocks of memory. They occupy heaps, which results in lots of contention to find free space to allocate new bitmaps as we scroll. This then results in more GC events so it can free up memory to provide the necessary space. Since there were so many images getting loaded in the list, these GC events were degrading the performance of our app.
GC events causes the application to freeze until it finishes. A few of these won’t matter, but too many of these events will result in a lower frame rate. Running a Garbage Collector also causes more CPU, which consumes battery usage.
Also, the higher the memory usage of an app, the more likely the system will decide to kill it when it’s running in the background.
We had to solve this problem before we could move any further with product development. And for that, we moved to an object pool concept for bitmaps, as advised by Colt in this video:
So the idea is instead of creating a brand new bitmap, you use an existing piece of memory to load the bitmap into:
mBitmapOptions.inBitmap = mCurrentBitmap;//using the mCurrentBitmap to load the new bitmapmCurrentBitmap = BitmapFactory.decodeFile(fileName, mBitmapOptions);
Then when you scroll through a long list of images, there’s no need to load all the images into separate memory allocations. You can just allocate a maximum number of bitmaps that are going to be visible, then reuse their memory — thereby avoiding those horrific GC events.
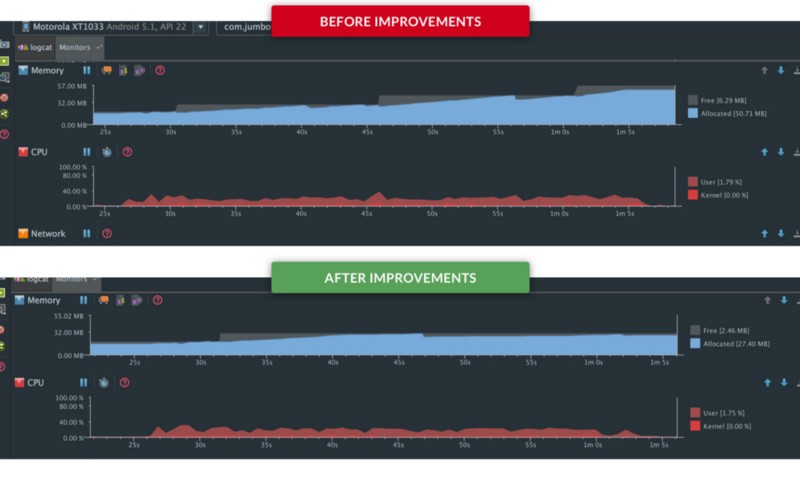
Here are the results showing the improvements:
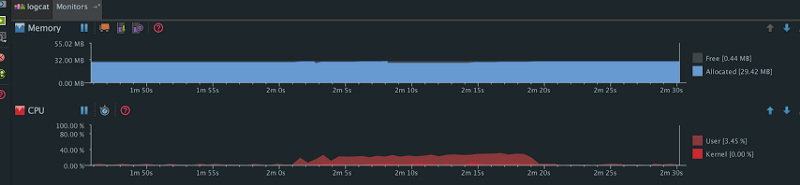
 Pic 4: Memory usage over time (improved)
We scrolled through the same product list again after doing the changes. We observed that with an initial 15 megabytes of memory already allocated, there was only 27 megabytes of total memory allocation done by the time we’d scrolled to the bottom of the page (and with a very few GC events).
 Pic 5: Memory usage over time (improved)
We scrolled a few more product lists and we observed no extra memory allocations (Bitmap Pool magic) and therefore no major GC events.
In the end, we had successfully reduced bitmap memory footprint by almost 50%.
We need to be mindful of the fact that Android has some constraint for reusing bitmaps, with respect to the physical size of the existing bitmaps:
- In SDK versions 11 through 18, the bitmaps that we load and the bitmaps that we are reusing must be exactly the same size. We solved this by using exact size of ImageView in our list for all versions of the SDK before version 18.
- In versions of the SDK newer than 19, existing bitmaps that we want to use could be greater than or equal to in the dimensions of the new incoming bitmap.
We also try to use same pixel format for reusing bitmaps. So to load an image as an RGB_565 bitmap, we use the RGB_565 bitmap allocation.
The good news is you don’t have to do all this on your own. There are already some amazing libraries like Glide and Fresco which have built-in capabilities for reusing bitmap memory. All you have to do is make sure your bitmaps can be reused. (Remember that there are constraints with respect to bitmap dimension and Bitmap.Config.) If you do not want to use these, you can just plug a Bitmap Pool into your existing image loader. Using these libraries will also help you save precious memory by pre-scaling bitmaps, and many more things.
Along with this, we also started using the RGB_565 format, which takes only 16 bits per pixel — as compared to ARGB_8888 which takes 32bits per pixel — on low memory devices. This further reduces our memory footprint.
There are many awesome things that you can do to improve your app’s performance. Will keep posting them. Let’s build better apps.
If you enjoyed reading this article, it would mean a lot if you recommend it using the ❤ icon and share with your colleagues and friends. Thanks!
Also, Let’s connect on Facebook, Twitter, Linkedin and Github.