By Zhen Liu
In my last post, we talked about how to pick the best month to sign the lease based on seasonality. Now, how long should you sign the lease for when facing different options like 12-month, 15-month, 18-month or longer? Is there any strategy in selecting the best option to save money?
To analyze this, I modelled 353 cities’ rent data from Zillow (one-bedroom, city-level data). In this article, I will show you how to make time series predictions, and which cities are predicted to increase the most in rent!
First, how does lease duration help you save money?
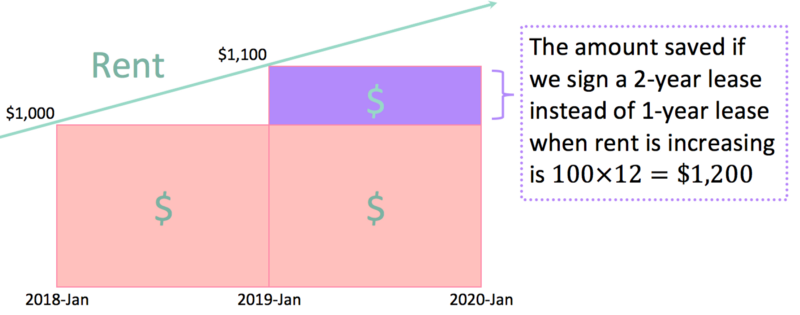
As shown below, you can save money by signing a longer lease if you predict the rent will increase in your city. If the monthly rent increases $100 in the next year, you’ll save $1,200 by signing a 2-year lease, then renew it year-by-year.
How do you predict if rent will increase?
We observed that rent is an additive time series with a combination of seasonality, trend and some random noise.
Additive model: Y(t) =Seasonality(t) + Trend(t) + Randomness(t)
We can decompose a time series into the right hand side of the equation above by applying R’s stl() function (stl stands for "seasonal and trend decomposition using locally weighted scatterplot smoothing”).
# Decompose the additive time seriesdecomposed_rent <- stl(rent.series, s.window="periodic") #periodic means the seasonality factor is same for every year
# Extract the components from time seriesseasonal <- decomposed_rent$time.series[,1]trend <- decomposed_rent$time.series[,2]random <- decomposed_rent$time.series[,3]
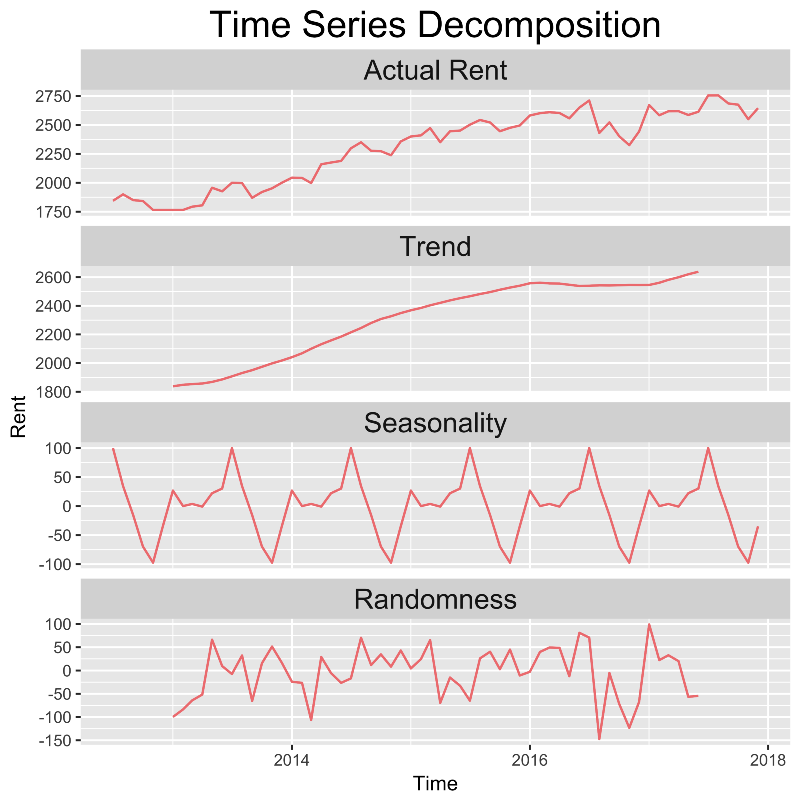 The plot of the decomposed time series of rent verified that the components are additive, where rent = Seasonality + Trend + Randomness
You can simply apply the st() function in R on the time series format of rent data to predict rent in the next 2 years.
# Forecast rent for the next 24 months with 95% Confidence Intervalfore_rent<-stlf(rent.series, s.window="period",h=24, level = 95)
Which cities have the predicted increase of rent?
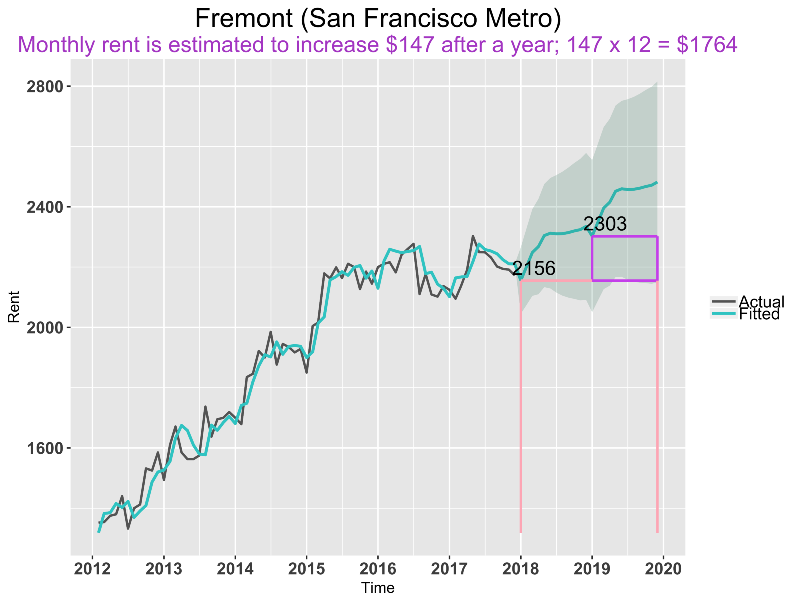
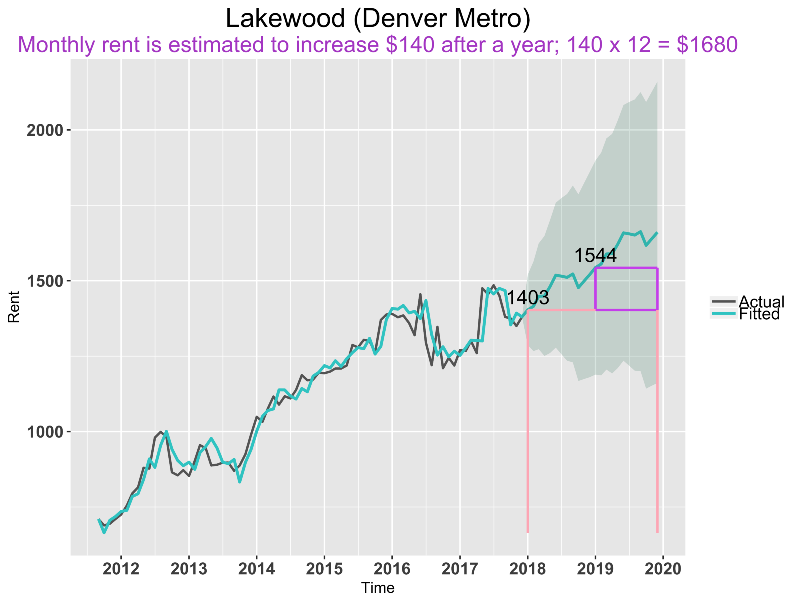
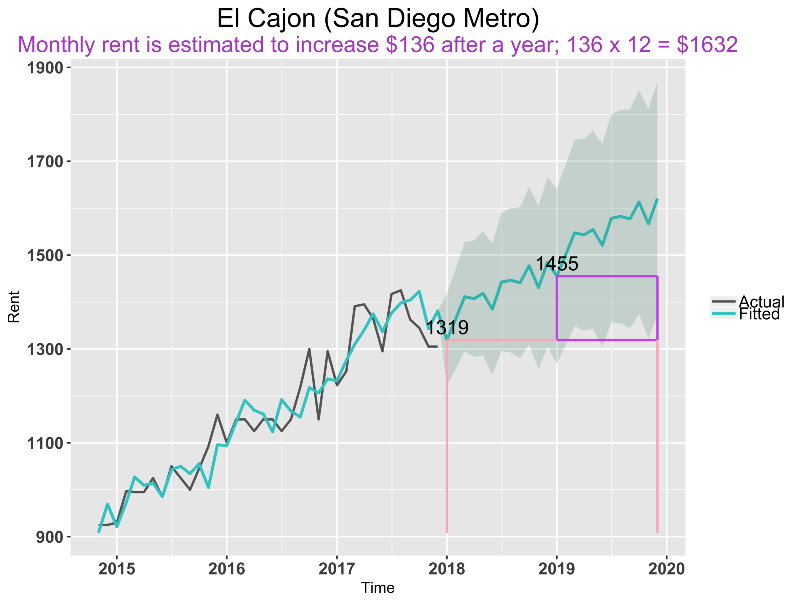
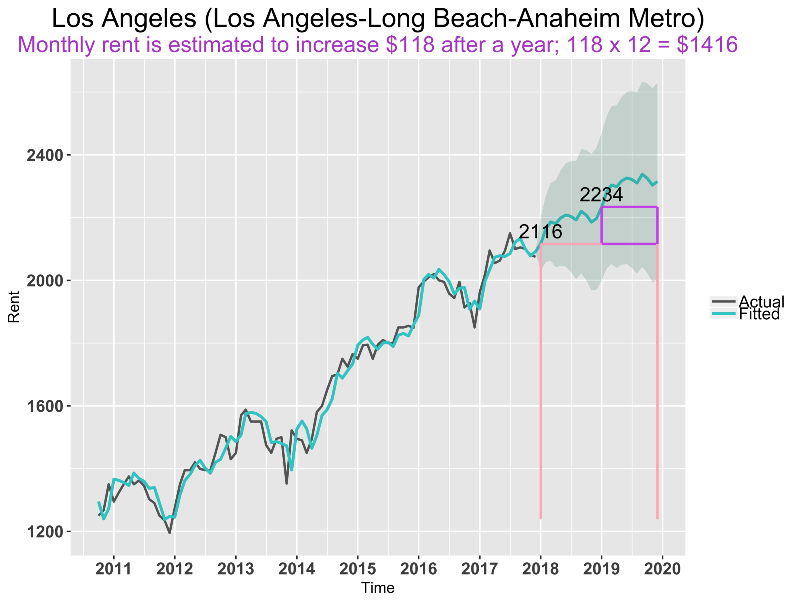
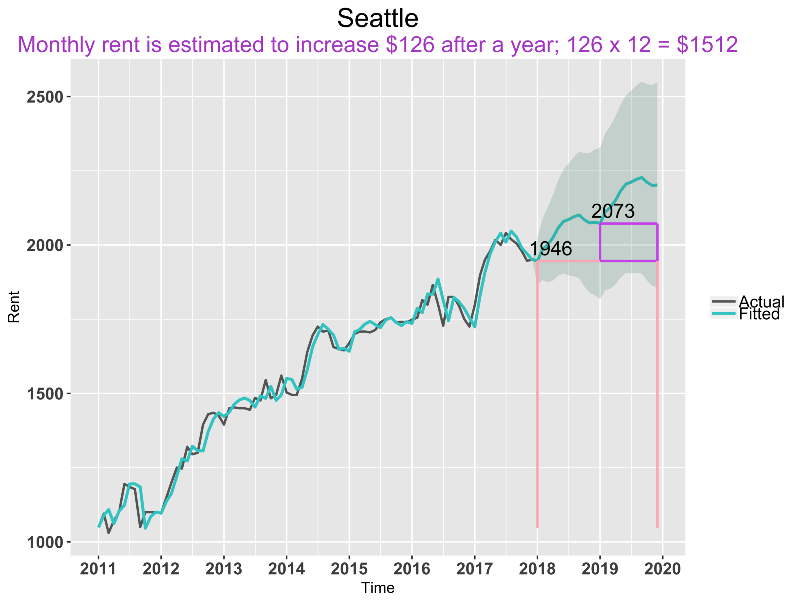
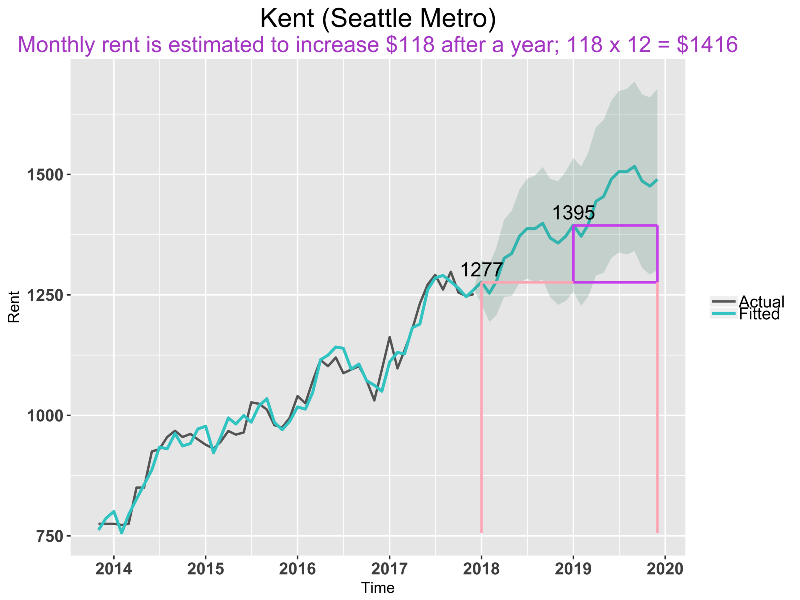
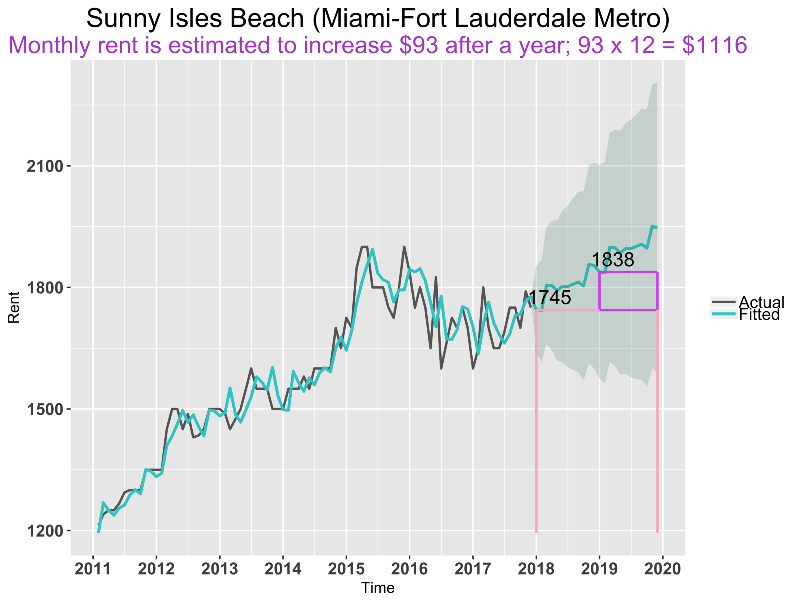
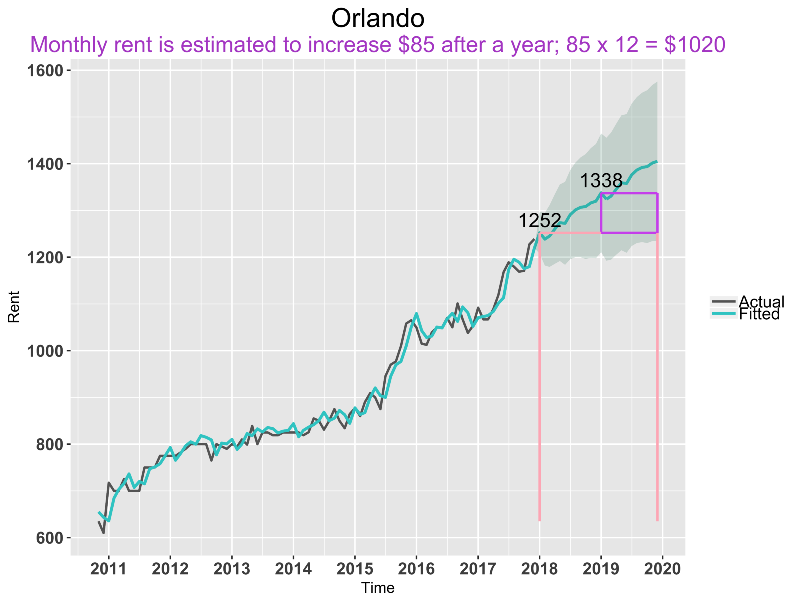
How to read the plots: The light green band area after 2018 is the 95% Confidence Interval of the rent prediction. The *text in purple tells you how much you can save if you sign a 2-year rent vs 1-year rent, according to the purple rectangular area outlined. I used ggplot2 for all the plots.
1. Bay Area
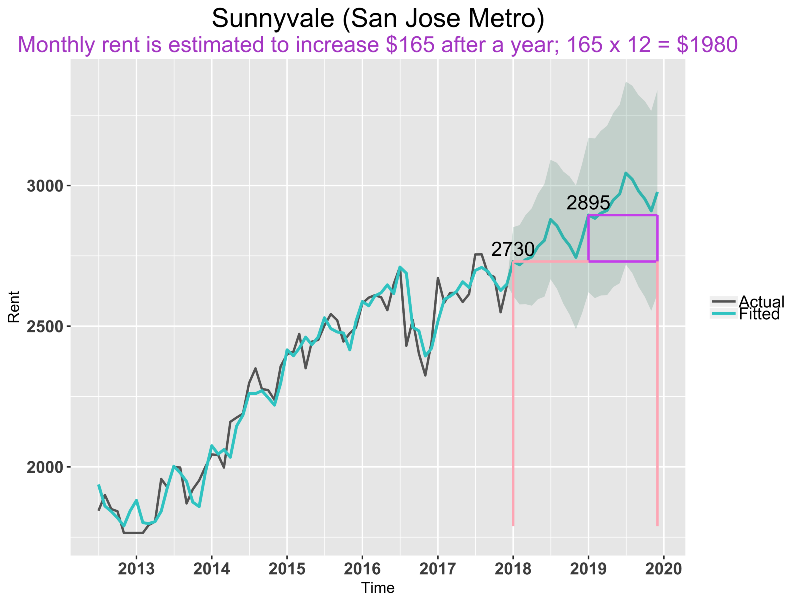
Sunnyvale’s predicted monthly rent increase is the greatest among all 246 cities I analyzed, which is $165 (comparing 2018–01’s rent to the predicted rent in 2019–01). So signing a 2-year lease in 2018 Jan can save you 16512= $ 1980 on the second year; signing a 18-month lease can save 1656 = $990. Given the seasonality effect in Sunnyvale, you should also try to avoid renewing the lease around July.
2.Denver
3.Southern California
4. Seattle Area
5. Florida
6. Texas
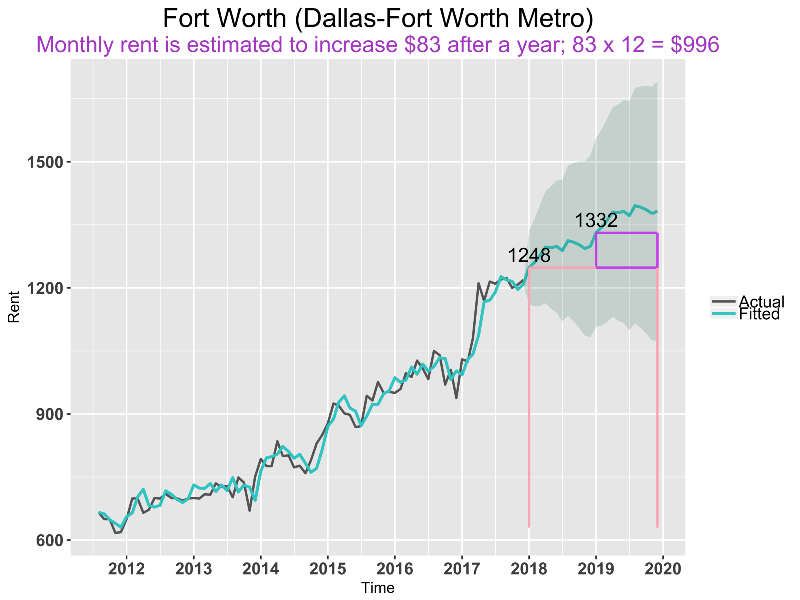
For the 11 cities above, if a 2-year lease isn’t an option, 18-months can still save a lot compared to an yearly updated increasing rent.
Which other cities show a huge leap in rent? I plotted the 20 cities total (including the cities mentioned above) to show you a comparison of rent as well as the increase of rent among more cities.
The length of line segment of each city is the increase of the rent where the red dot is the rent in 2018–01 and the green is the predicted rent in 2019 -01.
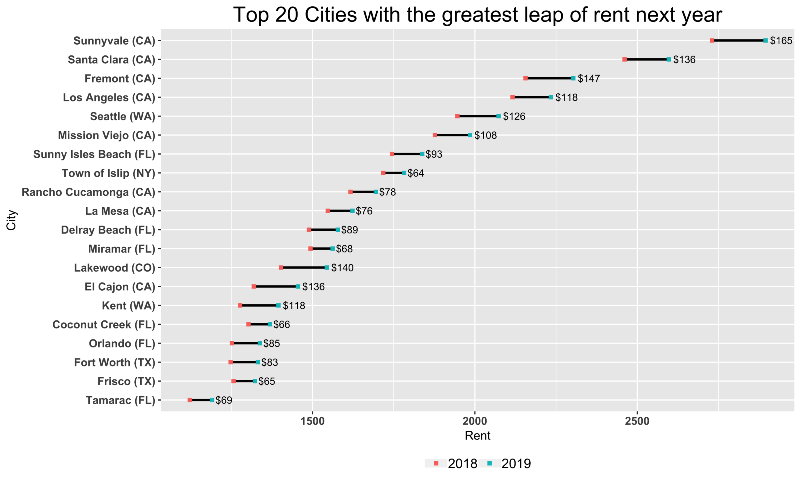
From the plot above, Lakewood (Denver Metro in CO) and El Cajon (San Diego Metro in CA)’s rents are not that high among the 20 cities, but the “step” of increase is bigger compared to other cities with similar range of rent.
The cities with rent >$2000 and significant predicted increase are all in CA (Top 4 of the plot). The rent there is already expensive, and they are getting more expensive, faster.
Among the top 20, there are 8 in CA, 6 in FL, 2 in WA, 2 in TX, 1 in NY and 1 in CO.
Are there any cities that don’t show much trend in rent?
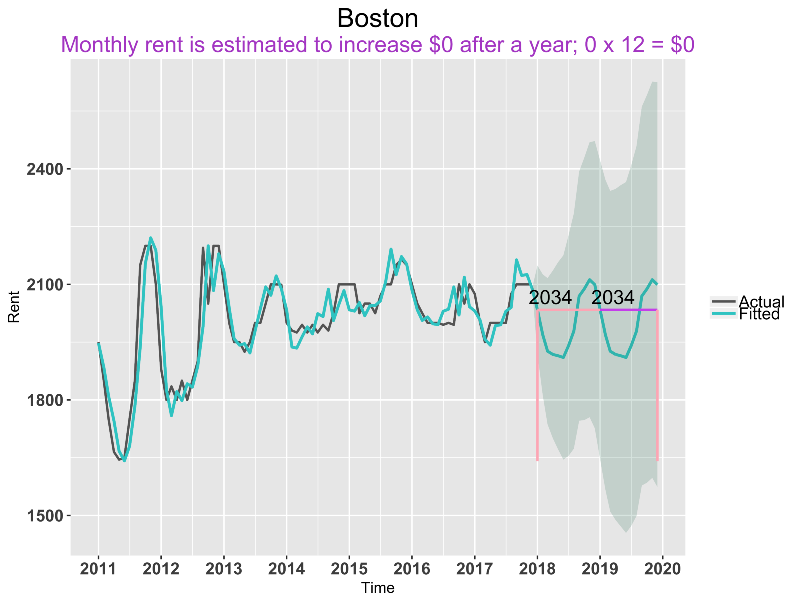
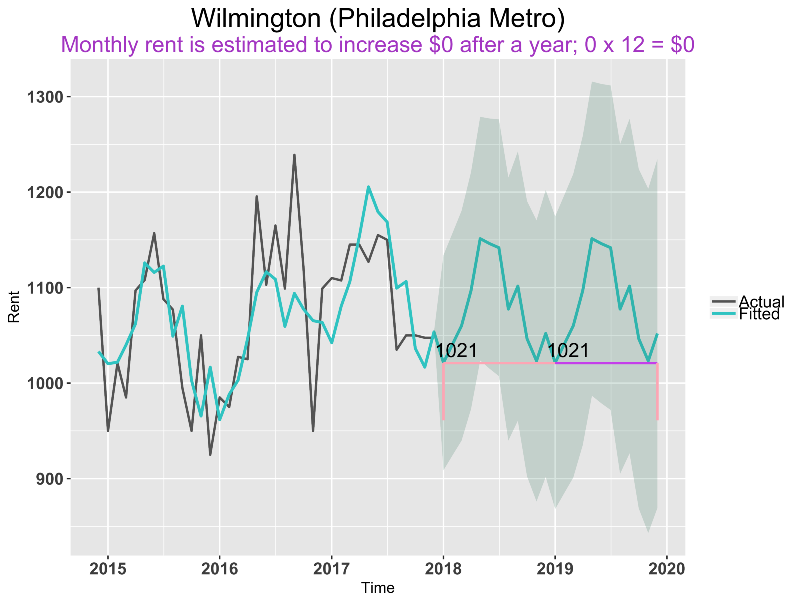
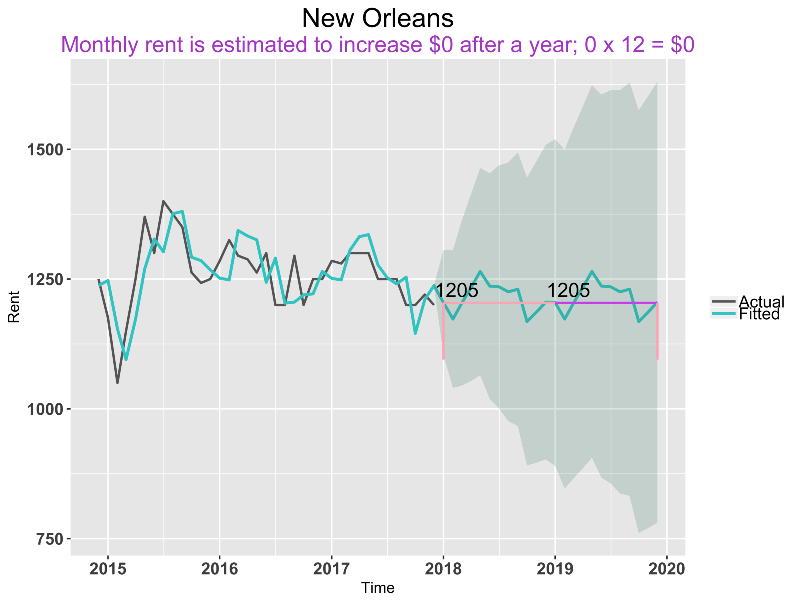
For the cities above, there’s no predicted increase. So for cities with very significant seasonality effect like Boston and Wilmington, it doesn’t really matter how long you sign the lease; but which month you sign.
The month with the highest rent in Boston is November, while it’s April in Wilmington.
If you are curious about what are other cities like this, read more about cities with seasonality in my last post!
_Find the R code for time series models and visualization with ggplot2 here._
Give me a few claps and follow me here if you find it helpful!