
By Zaid Humayun
Identifying performance issues has always been the holy grail of engineering. You want to be known as the software engineer who's able to diagnose and rectify the performance issue that came up in production. It really adds credibility to your engineering chops.
We had an issue at work recently that I thought would be fun to write about. I'll delve into the details of how we went about trying to find the root cause of the issue (which is 90% of the problem usually) and then how we fixed it.
Where The Problems Started
The problems started with AWS. The application had been humming along smoothly for a while with no issues whatsoever. We decide to run a load test to understand whether a specific API endpoint could handle the load that we expected it to have.
We downloaded JMeter, tried to figure out how to use it, and then gave up. We got back to it a day later and finally had some idea of how to get it up and running.
We pointed it to the test server running on AWS and launched 25 threads in a loop to run 8 times and promptly saw about 25% of the requests fail. The average time for the request was ~45 seconds. Not going to lie – this was pretty terrifying.
This scared us because it meant our route was so ridiculously inefficient that it managed to generate a throughput of only about 1.2 requests / second. But we expected it to handle a load of about 4-8 requests / second.
Okay, so what was going on? Why was this route so wildly inefficient?
Throttling The CPU
The immediate assumption we made is to point the finger of blame at the company's in-house ERP system that we depend upon for validation. Of course it had to be the ERP, because that meant we wouldn't have to take any responsibility for it since it's a different provider.
Well, after pointing JMeter at a local machine and running the same load test, we easily achieved the throughput that we wanted. In fact, we exceeded it by quite a bit. If it was the internal ERP system that was causing the issue, why couldn't it be reproduced on a local machine?
I reached out to someone who works at Amazon for help and got pointed in the direction of AWS throttling servers because our CPU load was never exceeding 10% on the EC2 test instance. And this opened up a whole can of worms for me.
So, when you are running your application on AWS, what exactly is happening? To be honest, I didn't really understand the internals and I still don't completely, but here's the gist.
You purchase compute time from AWS. What I thought this meant was that they ran our application on a server and we paid for the server time. But, this isn't quite accurate.
AWS has this concept of an EC2 Compute Unit (ECU) which is their way of abstracting away having to think about the servers your application is actually running on. If you can think in terms of ECU's, you don't have to worry about the actual physical infrastructure at all.
AWS later changed the ECU to a virtual CPU (vCPU), but you'll still find lots of references to an ECU on the web.
So, a vCPU is how they describe the computing power of their various instances. We're using a t2.micro EC2 instance for our test server and running two of them for our production server. Our application is mostly an OLTP workload which is read heavy.
Since AWS runs multiple applications on a single server separated by a hypervisor, they allocate a specific amount of compute bandwidth, network bandwidth, and storage to your application depending on your choice of instance.
How AWS manages this for t2 class of instances is through something called Burst Credits.
So, How Am I Losing Money On Burst Credits?
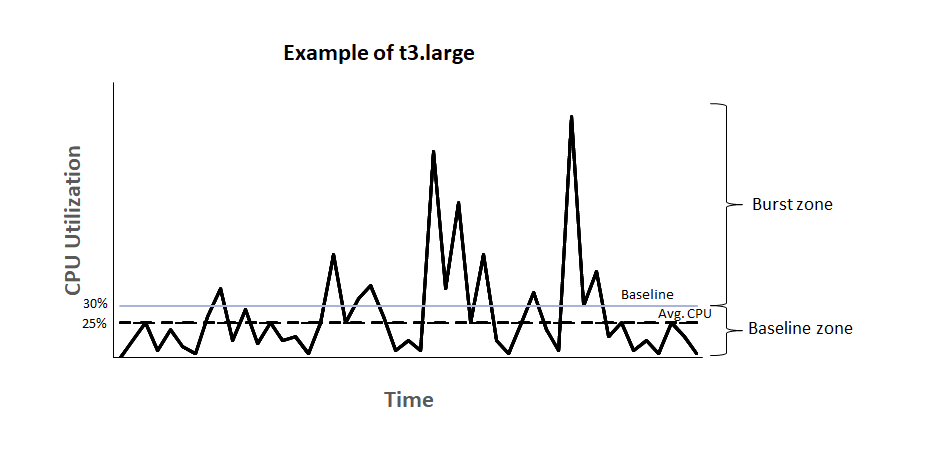
The chart above explains exactly how AWS burst credits work for EC2 instances. The source of the image is this AWS documentation.
The idea is that AWS provides you with a baseline CPU utilisation beyond which you pay for the CPU time that you consume.
Taking an EC2 t2.micro instances as an example, the baseline CPU utilisation for this is set at 10%. The instance is constantly earning credits based on the number of vCPU's it has.
The calculation for earning credits is:
1vCPU * 10% baseline * 60 minutes = 6 credits per hour.
The calculation for spending credits if you are utilising at 15% is:
1vCPU * 15% CPU * 60 minutes = 9 credits per hour.
So, if you are constantly running at 15%, your instance is losing 9 credits per hour. A t2.micro instance can only accrue a total of 144 credits. Once those credits run out, your CPU usage will be throttled at 10% which is the baseline utilistaion.
So, while you might not be strictly losing money on the instance, you are paying for it in CPU cycles that are lost.
Another way to confirm that you are losing CPU cycles because of throttling is to login to your EC2 instance and run the top command to check the steal time. If you try to load test your server and your CPU is throttled, then you can watch in real time as the steal time goes up to prevent your process from taking any additional CPU time.
DB Failures
Okay, so if the issue is the throttling of the EC2 instance, removing the throttling should fix the issue, right? Well, we checked our production instances and noticed that they were also having failures even though they weren't being throttled.
On the production instances, we realised that some requests were taking more than 10 seconds and were timing out once it became 2pm.
Why is the 2PM time relevant?
Because the same way that AWS limits the CPU cycles you can use on an EC2 server, they also limit the number of IOPS you have available to your RDS instances.
AWS limits your IOPS at the rate of 3 * (storage assigned to your EBS volume). When you instantiate an RDS instance, you also need to assign some disk storage to it. By decoupling these two from each other is how AWS manages to upgrade your RDS instance without affecting any of the data.
We started out with 20GB in our GP2 storage, which gives us 60IOPS. AWS, however, provides a minimum of 100 IOPS.
Every time your RDS instance goes above 100 IOPS, however, you consume burst credits which are specific to DB instances and different from CPU credits for EC2 instances.
The reason users were facing a slow down at around 2PM everyday was because our IOPS would be over 100 throughout the day, which would consume burst credits which would then run out by 2PM, post which we were limited to 100 IOPS.
This caused all the timeouts our users were facing! We figured the simplest and cheapest way to fix this would be to increase the storage capacity of our EBS volume. We increased it to 100GB which gave us a baseline of 300 IOPS. We figured this would be enough because our average IOPS over the course of a day had wild fluctuations but seemed to average around this number.
We upgraded our EBS volume and waited for the next afternoon – and the exact same issue came up again!
When viewing our average IOPS, I had picked the 1m interval which didn't give a fair reflection of the average since it showed a lot of spikes. Picking the 1 hour interval showed a significantly higher average of 600 IOPS!
Upon investigating the IOPS issue a little deeper, I found that the read IOPS were contributing most of the load to the total IOPS.
As a last resort, we decided to enable Performance Insights on the AWS console for our RDS instance so we could see which queries were eating up most of the IOPS and fix that specific query.
When we were trying to enable Performance Insights, we found that it wouldn't work for anything less than a db.t3.medium which forced us to upgrade to a DB instance with 4GB of RAM.
We upgraded the instance and then restarted the DB server and waited. I kept a close eye on the IOPS metric but it didn't seem to be budging beyond 0-10 IOPS, which I assumed meant that nobody was using the application yet.
I checked and was told repeatedly that people were using the application and it was working completely fine but I just couldn't understand what was going on. Why was it working? It shouldn't have been working, there were barely any IOPS happening.
Remembering Why RAM Matters
Well, one of the things that I didn't realize was how RAM impacts how many IOPS occur for a database.
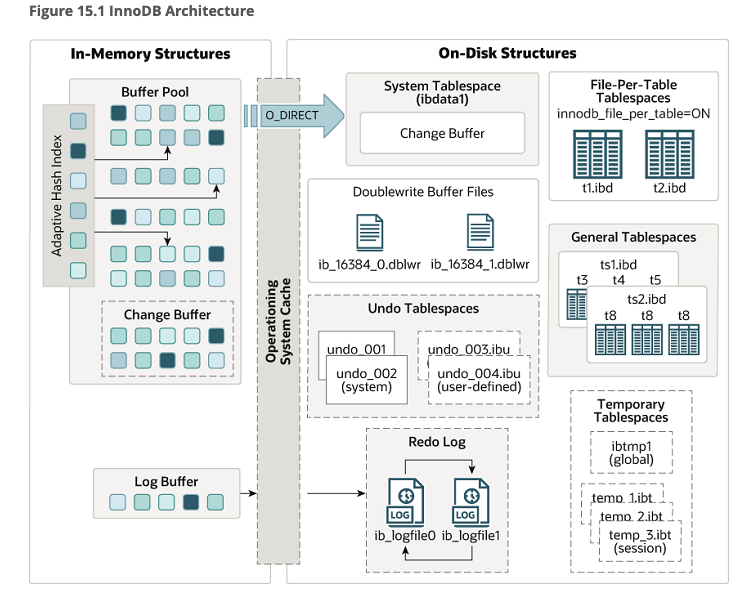
AWS measures IOPS as the reads and writes to the hard disk itself. It doesn't measure it as reads / writes to the buffer pool maintained by the innoDB engine in MySQL.
The issue was that the previous DB instance we had used (the db.t2.micro) had only 1BG of RAM, which meant the buffer pool size was about 250MB. On the new instance which had 4GB of RAM, it meant that the buffer pool had 2GB to work with.
The offending query that was causing the high number of IOPS was querying a table of about 210 MB in size. And since it was doing a table scan, it was loading almost the entire table into the buffer pool and then running whatever operations it had to on it.
Since the buffer pool was only about 250 MB, once it loaded the big table, it would constantly remove all other data and then it would have to go back to the disk to fetch them, leading to more IOPS.
The Offending Query
There is still a missing piece to this puzzle. What is this query that is causing 210MB of data to be loaded into memory each time it runs? Sure, we fixed the issue by increasing the RAM, however there was clearly something going wrong here. The table was only going to grow in size and constantly increasing RAM wasn't a good fix.
Below is the query that was causing all the issues:
EXPLAIN ANALYZE
SELECT `oc`.`oc_number` AS `ocNumber` , `roll`.`po_number` AS `poNumber` ,
`item`.`item_code` AS `itemCode` , `roll`.`roll_length` AS `rollLength` ,
`roll`.`roll_utilized` AS `rollUtilized`
FROM `fabric_barcode_rolls` AS `roll`
INNER JOIN `fabric_barcode_oc` AS `oc` ON `oc`.`oc_unique_id` = `roll` . `oc_unique_id`
INNER JOIN `fabric_barcode_items` AS `item` ON `item`.`item_unique_id` = `roll`.`item_unique_id_fk`
WHERE BINARY `roll`.`roll_number` = 'dZkzHJ_je8'
Upon running EXPLAIN ANALYZE on it, MySQL provided the following query plan:
-> Nested loop inner join  (cost=468792.05 rows=582836) (actual time=0.092..288.104 rows=1 loops=1)
    -> Nested loop inner join  (cost=264799.45 rows=582836) (actual time=0.067..288.079 rows=1 loops=1)
        -> Filter: (cast(roll.roll_number as char charset binary) = 'dZkzHJ_je8')  (cost=60806.85 rows=582836) (actual time=0.053..288.064 rows=1 loops=1)
            -> Table scan on roll  (cost=60806.85 rows=582836) (actual time=0.048..230.675 rows=600367 loops=1)
        -> Single-row index lookup on oc using PRIMARY (oc_unique_id=roll.oc_unique_id)  (cost=0.25 rows=1) (actual time=0.014..0.014 rows=1 loops=1)
    -> Single-row index lookup on item using PRIMARY (item_unique_id=roll.item_unique_id_fk)  (cost=0.25 rows=1) (actual time=0.024..0.024 rows=1 loops=1)
Looking at the query plan, its odd how there is a full table scan on the roll table happening each time the query runs. It looks at 582,000 rows each time which is where the performance issues were coming from.
This seemed like an issue with poor indexing. So, I went through the tables and viewed the indexes on each one and made sure they were accurate. I tried rewriting the query to filter the roll table before running the rest of the query and the performance was even worse.
Finally, on a whim I removed the BINARY function call in the query which I had put in to make sure that case sensitivity would not be an issue. The resulting query execution plan was shocking:
-> Rows fetched before execution (cost=0.00 rows=1) (actual time=0.000..0.000 rows=1 loops=1)
Just a ridiculous amount of execution time was being wasted by that one function call. So, why was that one function call causing all these issues?
I thought about it and did what every self-respecting software engineer does when faced with a problem they can't figure out. I posted the question on Stack Overflow.
Here's a link to the question. The answer is that it has to do with column collation.
Since I was casting each value in the roll_number column in the roll table to a binary value, MySQL can't use indexes unless that specific collation is defined on the column in the DDL.
Since the index was useless, it was doing a full table scan and checking the value of each and every row through nested inner joins.
Removing the BINARY function call was the easiest way to solve the issue. But changing the column collation to use the Latin character set and be case sensitive so the index is built with case sensitivity ensured that we didn't run into issues with barcode collisions occurring.
Challenges With AWS
There is no doubt that AWS has done a wonderful job of abstracting away the hardware from millions of software engineers. But it has simultaneously made pricing so difficult to understand that nobody really knows how much they're paying until its too late.
We can't downgrade the EBS volume from 100GB back down to 20GB because AWS won't allow it. We have no need for the extra storage and it doesn't make sense to have it but we're stuck with it.
We also can't downgrade from db.t3.medium to db.t3.micro because we lose access to Performance Insights. Sure, we could recreate Performance Insights because it's essentially built on top of Performance Schema which is a native MySQL feature – but it's so much engineering time which contributes nothing in terms of value to our end customer.
In Closing
I love AWS and I love how easy it has made hardware access for millions of developers. But, I can't help but get frustrated at the poor documentation surrounding AWS and how easy it is to shoot yourself in the foot unless you're willing to constantly cough up money.
I know that understanding how hardware is being used is a must for software engineers. But it feels like a double whammy when you need to spend so much time understanding the AWS abstraction that should be removing the need to worry about the underlying hardware.
AWS has an Aurora DB which seems like a managed database that prevents these kinds of issues from occurring. But sometimes it feels easier to just run your own hardware like Oxide Computer encourages people to do.
Note: You can find this and other articles on my blog here.