By Shachee Swadia
Data visualization is a powerful tool that helps us make sense of complex data. With it, we can spot patterns and trends that might take much more time to become obvious just by looking at raw numbers.
One particularly useful chart type is the heatmap, and I’m excited to teach you how to create one with JavaScript in this tutorial.
What is a Heatmap?
A heatmap is a two-dimensional representation of the magnitude of a phenomenon through colors. It provides a quick visual summary of high and low values in the data.
For instance, did you know that an average of 108 people died per day in road accidents in the U.S. in 2021? Using a heatmap chart, we can analyze the days and times of fatal accidents. This will be the visualization we will be building during the tutorial.
So, grab your cup of coffee and let's dive into this step-by-step guide. By the end, you'll have the skills to easily create your own interactive JavaScript heatmaps.
The Heatmap Chart We'll Build
Here is how the final JS-based heatmap chart will look:

Ready to dive in? Let's go!
How to Make a JavaScript Heatmap
Great, let's start creating a simple yet beautiful heatmap chart using JavaScript. With just four easy-to-follow steps, you'll have a stunning interactive heatmap in no time.
Don't worry about any complicated coding or overwhelming technicalities. We'll keep things straightforward and easy to understand.
1. Create an HTML Page
First things first, we need to create a web page that'll hold our super-cool heatmap. We start by making a basic HTML page, complete with a div element to hold our chart. Let’s also specify the style of the div to make it stretch over the whole page. Don't worry, it’s easy-peasy:
<html>
  <head>
    <title>Heatmap in JavaScript</title>
    <style type="text/css">
      html, body, #container {
        width: 100%; margin: 0; padding: 0;
      }
    </style>
  </head>
  <body>
    <div id="container"></div>
  </body>
</html>
2. Include the Required JavaScript Files
Okay, let's be real: building a JS heatmap from scratch would be a real pain in the you-know-what. Instead, we're gonna take the easier route and use a JavaScript charting library.
There are a ton of various JS charting libraries out there. For this project, we're gonna go with the AnyChart JS library, which supports heatmap charts and is free for personal and other non-profit purposes.
To make things work, we need to add a couple of scripts to our web page's <head> section. Specifically, we need to include the base and heatmap modules. Sounds easy, right?
<html>
  <head>
    <title>Heatmap in JavaScript</title>
    <script src="https://cdn.anychart.com/releases/8.11.0/js/anychart-core.min.js"></script>
    <script src="https://cdn.anychart.com/releases/8.11.0/js/anychart-heatmap.min.js"></script>
    <style type="text/css">
      html, body, #container {
        width: 100%; margin: 0; padding: 0;
      }
    </style>
  </head>
  <body>
    <div id="container"></div>
    <script>
      // All the code for the JS heatmap will come here
    </script>
  </body>
</html>
3. Add the Data
Each chart is complete with the data, right? We’re gonna grab our data from the NSC website and add it to our HTML file in the proper format.
For our heatmap, each data point needs to include an x value (day), a y value (hour), and a heat value (number of accidents). We'll wrap this data in a function that we'll call when we create the JS chart.
function getData() {
  return [
    {
      x: "Monday",
      y: "Midnight–3:59 a.m.",
      heat: 705
    },
    {
      x: "Monday",
      y: "4:00–7:59 a.m.",
      heat: 713
    },
    {
      x: "Monday",
      y: "8:00–11:59 a.m.",
      heat: 657
    },
    {
      x: "Monday",
      y: "Noon–3:59 p.m.",
      heat: 957
    },
    {
      x: "Monday",
      y: "4:00–7:59 p.m.",
      heat: 1137
    },
    {
      x: "Monday",
      y: "8:00–11:59 p.m.",
      heat: 956
    },
    {
      x: "Tuesday",
      y: "Midnight–3:59 a.m.",
      heat: 482
    },
    {
      x: "Tuesday",
      y: "4:00–7:59 a.m.",
      heat: 641
    },
    {
      x: "Tuesday",
      y: "8:00–11:59 a.m.",
      heat: 631
    },
    {
      x: "Tuesday",
      y: "Noon–3:59 p.m.",
      heat: 905
    },
    {
      x: "Tuesday",
      y: "4:00–7:59 p.m.",
      heat: 1137
    },
    {
      x: "Tuesday",
      y: "8:00–11:59 p.m.",
      heat: 986
    },
    {
      x: "Wednesday",
      y: "Midnight–3:59 a.m.",
      heat: 465
    },
    {
      x: "Wednesday",
      y: "4:00–7:59 a.m.",
      heat: 616
    },
    {
      x: "Wednesday",
      y: "8:00–11:59 a.m.",
      heat: 627
    },
    {
      x: "Wednesday",
      y: "Noon–3:59 p.m.",
      heat: 914
    },
    {
      x: "Wednesday",
      y: "4:00–7:59 p.m.",
      heat: 1159
    },
    {
      x: "Wednesday",
      y: "8:00–11:59 p.m.",
      heat: 1066
    },
    {
      x: "Thursday",
      y: "Midnight–3:59 a.m.",
      heat: 584
    },
    {
      x: "Thursday",
      y: "4:00–7:59 a.m.",
      heat: 718
    },
    {
      x: "Thursday",
      y: "8:00–11:59 a.m.",
      heat: 660
    },
    {
      x: "Thursday",
      y: "Noon–3:59 p.m.",
      heat: 966
    },
    {
      x: "Thursday",
      y: "4:00–7:59 p.m.",
      heat: 1161
    },
    {
      x: "Thursday",
      y: "8:00–11:59 p.m.",
      heat: 1186
    },
    {
      x: "Friday",
      y: "Midnight–3:59 a.m.",
      heat: 715
    },
    {
      x: "Friday",
      y: "4:00–7:59 a.m.",
      heat: 747
    },
    {
      x: "Friday",
      y: "8:00–11:59 a.m.",
      heat: 738
    },
    {
      x: "Friday",
      y: "Noon–3:59 p.m.",
      heat: 1056
    },
    {
      x: "Friday",
      y: "4:00–7:59 p.m.",
      heat: 1426
    },
    {
      x: "Friday",
      y: "8:00–11:59 p.m.",
      heat: 1631
    },
    {
      x: "Saturday",
      y: "Midnight–3:59 a.m.",
      heat: 1383
    },
    {
      x: "Saturday",
      y: "4:00–7:59 a.m.",
      heat: 641
    },
    {
      x: "Saturday",
      y: "8:00–11:59 a.m.",
      heat: 635
    },
    {
      x: "Saturday",
      y: "Noon–3:59 p.m.",
      heat: 1034
    },
    {
      x: "Saturday",
      y: "4:00–7:59 p.m.",
      heat: 1400
    },
    {
      x: "Saturday",
      y: "8:00–11:59 p.m.",
      heat: 1593
    },
    {
      x: "Sunday",
      y: "Midnight–3:59 a.m.",
      heat: 1486
    },
    {
      x: "Sunday",
      y: "4:00–7:59 a.m.",
      heat: 695
    },
    {
      x: "Sunday",
      y: "8:00–11:59 a.m.",
      heat: 564
    },
    {
      x: "Sunday",
      y: "Noon–3:59 p.m.",
      heat: 932
    },
    {
      x: "Sunday",
      y: "4:00–7:59 p.m.",
      heat: 1292
    },
    {
      x: "Sunday",
      y: "8:00–11:59 p.m.",
      heat: 1211
    }
  ];
}
4. Write the Necessary JS Code for the Chart
Here's the fun part: it's time to write the JavaScript code that'll make our heatmap chart look amazing.
We'll enclose everything in a function to ensure the code only executes when the page is ready. We'll create the graph using the heatmap() function and add the data we created in the previous step.
let chart = anychart.heatMap(getData());
Then, we'll give the chart a descriptive title:
chart.title("Fatal Car Crashes in U.S. in 2021 by Time of Day and Day of Week”);
Finally, we'll set the container reference and draw the chart. Voilà!
сhart.container('container’);
chart.draw();
And there you have it. With just a little bit of HTML and JavaScript, you can create a totally rad interactive heatmap. You can see the entire code of this JS-based heatmap below and check it out live here. After that, we'll learn how to customize our heatmap in all kinds of fun ways.
<html>
  <head>
    <title>Heatmap in JavaScript</title>
    <script src="https://cdn.anychart.com/releases/8.11.0/js/anychart-core.min.js"></script>
    <script src="https://cdn.anychart.com/releases/8.11.0/js/anychart-heatmap.min.js"></script>
    <style type="text/css">
      html, body, #container {
        width: 100%; margin: 0; padding: 0;
      }
    </style>
  </head>
  <body>
    <div id="container"></div>
    <script>
      anychart.onDocumentReady(function () {
        // create a heatmap
        let chart = anychart.heatMap(getData());
        // name the heatmap
        chart.title("Fatal Car Crashes in U.S. in 2021 by Time of Day and Day of Week");
        // set the container for the heatmap
        chart.container("container");
        // draw the heatmap
        chart.draw();
      });
      // add the data
      function getData() {
        return [
          {
            x: "Monday",
            y: "Midnight–3:59 a.m.",
            heat: 705
          },
          {
            x: "Monday",
            y: "4:00–7:59 a.m.",
            heat: 713
          },
          {
            x: "Monday",
            y: "8:00–11:59 a.m.",
            heat: 657
          },
          {
            x: "Monday",
            y: "Noon–3:59 p.m.",
            heat: 957
          },
          {
            x: "Monday",
            y: "4:00–7:59 p.m.",
            heat: 1137
          },
          {
            x: "Monday",
            y: "8:00–11:59 p.m.",
            heat: 956
          },
          {
            x: "Tuesday",
            y: "Midnight–3:59 a.m.",
            heat: 482
          },
          {
            x: "Tuesday",
            y: "4:00–7:59 a.m.",
            heat: 641
          },
          {
            x: "Tuesday",
            y: "8:00–11:59 a.m.",
            heat: 631
          },
          {
            x: "Tuesday",
            y: "Noon–3:59 p.m.",
            heat: 905
          },
          {
            x: "Tuesday",
            y: "4:00–7:59 p.m.",
            heat: 1137
          },
          {
            x: "Tuesday",
            y: "8:00–11:59 p.m.",
            heat: 986
          },
          {
            x: "Wednesday",
            y: "Midnight–3:59 a.m.",
            heat: 465
          },
          {
            x: "Wednesday",
            y: "4:00–7:59 a.m.",
            heat: 616
          },
          {
            x: "Wednesday",
            y: "8:00–11:59 a.m.",
            heat: 627
          },
          {
            x: "Wednesday",
            y: "Noon–3:59 p.m.",
            heat: 914
          },
          {
            x: "Wednesday",
            y: "4:00–7:59 p.m.",
            heat: 1159
          },
          {
            x: "Wednesday",
            y: "8:00–11:59 p.m.",
            heat: 1066
          },
          {
            x: "Thursday",
            y: "Midnight–3:59 a.m.",
            heat: 584
          },
          {
            x: "Thursday",
            y: "4:00–7:59 a.m.",
            heat: 718
          },
          {
            x: "Thursday",
            y: "8:00–11:59 a.m.",
            heat: 660
          },
          {
            x: "Thursday",
            y: "Noon–3:59 p.m.",
            heat: 966
          },
          {
            x: "Thursday",
            y: "4:00–7:59 p.m.",
            heat: 1161
          },
          {
            x: "Thursday",
            y: "8:00–11:59 p.m.",
            heat: 1186
          },
          {
            x: "Friday",
            y: "Midnight–3:59 a.m.",
            heat: 715
          },
          {
            x: "Friday",
            y: "4:00–7:59 a.m.",
            heat: 747
          },
          {
            x: "Friday",
            y: "8:00–11:59 a.m.",
            heat: 738
          },
          {
            x: "Friday",
            y: "Noon–3:59 p.m.",
            heat: 1056
          },
          {
            x: "Friday",
            y: "4:00–7:59 p.m.",
            heat: 1426
          },
          {
            x: "Friday",
            y: "8:00–11:59 p.m.",
            heat: 1631
          },
          {
            x: "Saturday",
            y: "Midnight–3:59 a.m.",
            heat: 1383
          },
          {
            x: "Saturday",
            y: "4:00–7:59 a.m.",
            heat: 641
          },
          {
            x: "Saturday",
            y: "8:00–11:59 a.m.",
            heat: 635
          },
          {
            x: "Saturday",
            y: "Noon–3:59 p.m.",
            heat: 1034
          },
          {
            x: "Saturday",
            y: "4:00–7:59 p.m.",
            heat: 1400
          },
          {
            x: "Saturday",
            y: "8:00–11:59 p.m.",
            heat: 1593
          },
          {
            x: "Sunday",
            y: "Midnight–3:59 a.m.",
            heat: 1486
          },
          {
            x: "Sunday",
            y: "4:00–7:59 a.m.",
            heat: 695
          },
          {
            x: "Sunday",
            y: "8:00–11:59 a.m.",
            heat: 564
          },
          {
            x: "Sunday",
            y: "Noon–3:59 p.m.",
            heat: 932
          },
          {
            x: "Sunday",
            y: "4:00–7:59 p.m.",
            heat: 1292
          },
          {
            x: "Sunday",
            y: "8:00–11:59 p.m.",
            heat: 1211
          }
        ];
      }
    </script>
  </body>
</html>
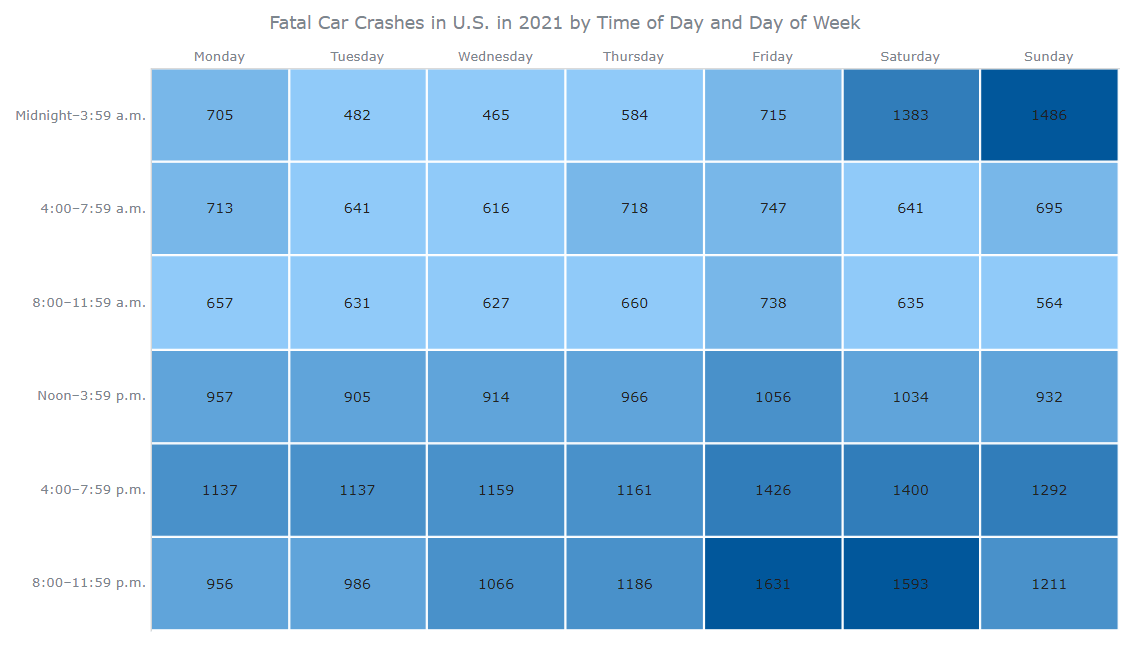
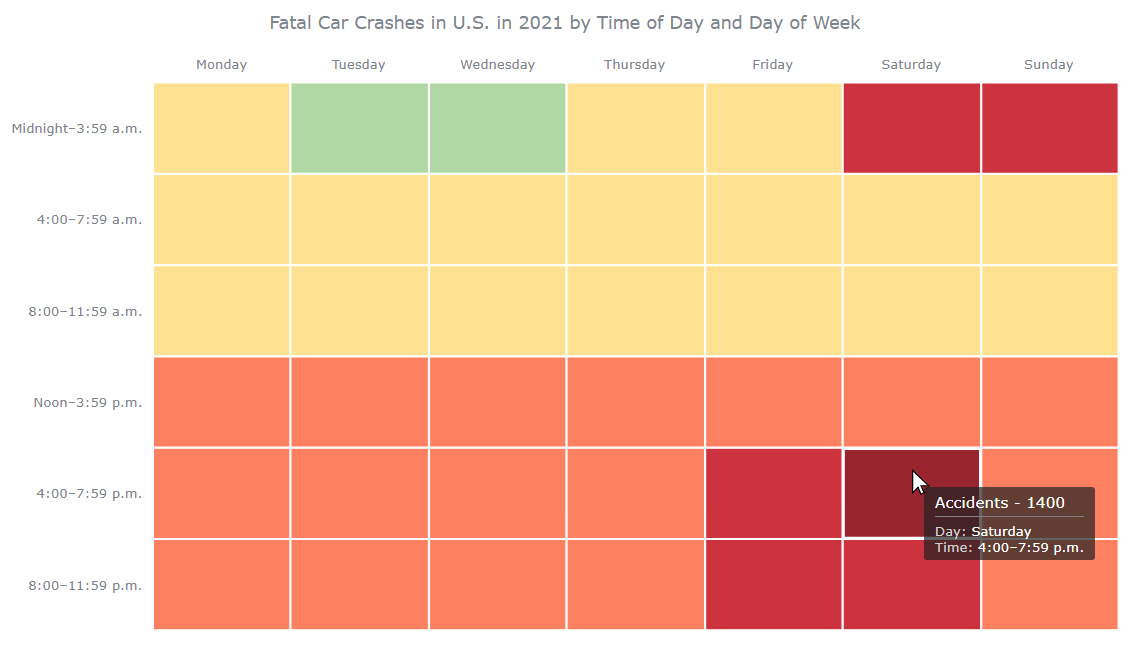
This heatmap is both visually appealing and informative. Upon examining the chart, it becomes clear that there are certain times when the number of accidents is significantly higher. It is unsurprising to see that these peak times are during weekends and the darker hours of the day.
But there's a lot more we can do with our heatmap...
How to Customize a JS Heatmap
As we saw, having the basic chart ready was really simple and fast. But there is so much more we can do to enhance the heatmap. It's not so difficult, either.
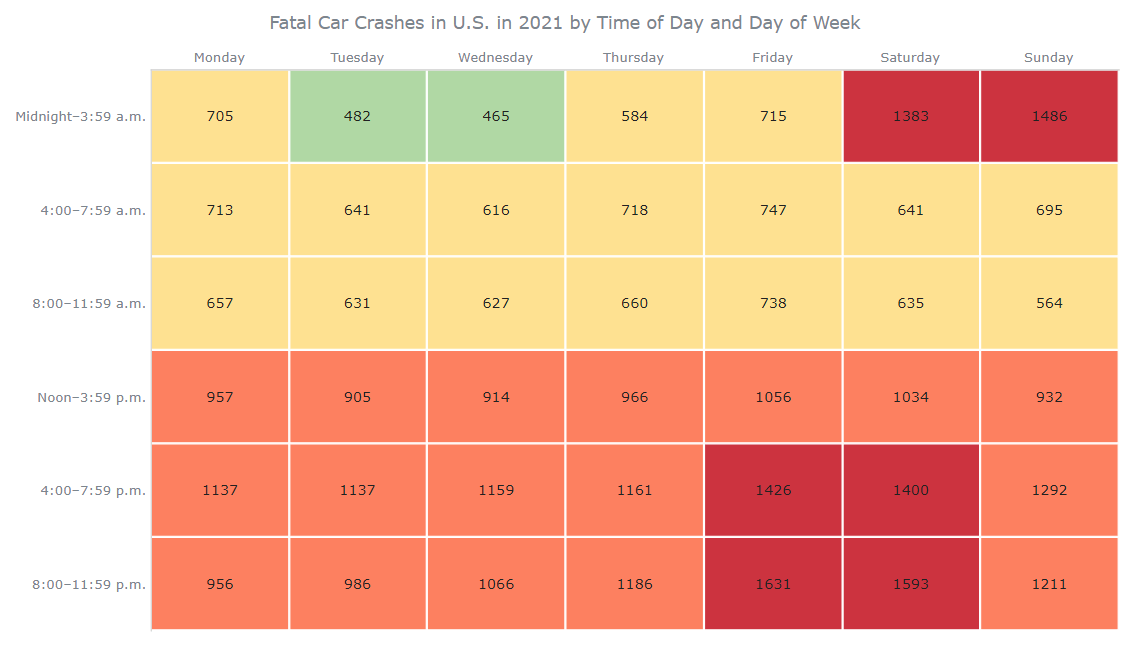
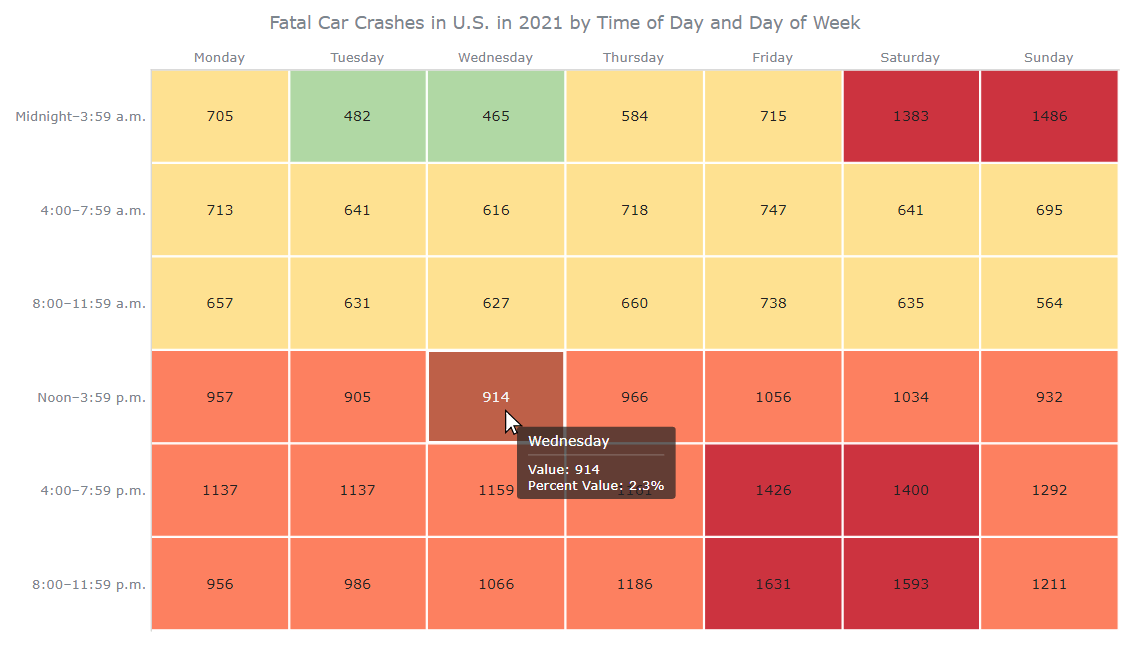
How to Change the Color Palette
We can use a diverging colour palette to make our JavaScript heatmap more effective in highlighting the data. This type of color scheme helps to emphasize the difference between high and low values, with less being good and more being alarming.
We can define four colors and value ranges using an ordinal color scale and then set the chart colors to use that color scale. This way, we can create a heatmap that quickly draws the viewer's attention to the most significant data points.
Here's the code to do that:
let colorScale = anychart.scales.ordinalColor();
colorScale.ranges([
  { less: 500, color: "#B0D8A4" },
  { from: 500, to: 900, color: "#FEE191" },
  { from: 900, to: 1300, color: "#FD8060" },
  { greater: 1300, color: "#CC333F" }
]);
chart.colorScale(colorScale);
And here's the result:
How to Modify the Hover Styling
When we change the color palette of our heatmap, we also need to modify the hover colors to match the base colors. This is simple to achieve with the color.darken function.
We can set the chart settings and hover chart settings to ensure that the hover colors match the base colors. This allows us to create a visually consistent and easy-to-read heatmap, making it more effective in communicating the underlying data.
chart
  .hovered()
  .fill(function () {
    return anychart.color.darken(this.sourceColor, 0.25);
  });
How to Change the Labels
By default, the labels on our heatmap show the actual numbers. But we can customize the labels to provide greater flexibility and make the chart easier to read.
We can enable HTML for the labels to allow for greater formatting options. Then, we can configure the labels to display as 'low' to 'extreme' based on the value of the tile. We can also make the 'high' and 'extreme' values appear in bold to make them stand out.
// enable html for the labels
chart.labels().useHtml(true);

// configure the labels
chart.labels().format(function () {
  var heat = this.heat;
  if (heat < 500) return "Low";
  if (heat < 1000) return "Medium";
  if (heat < 1500) return "<span style='font-weight:bold'>High</span>";
  if (heat >= 1500) return "<span style='font-weight:bold'>Extreme</span>";
});

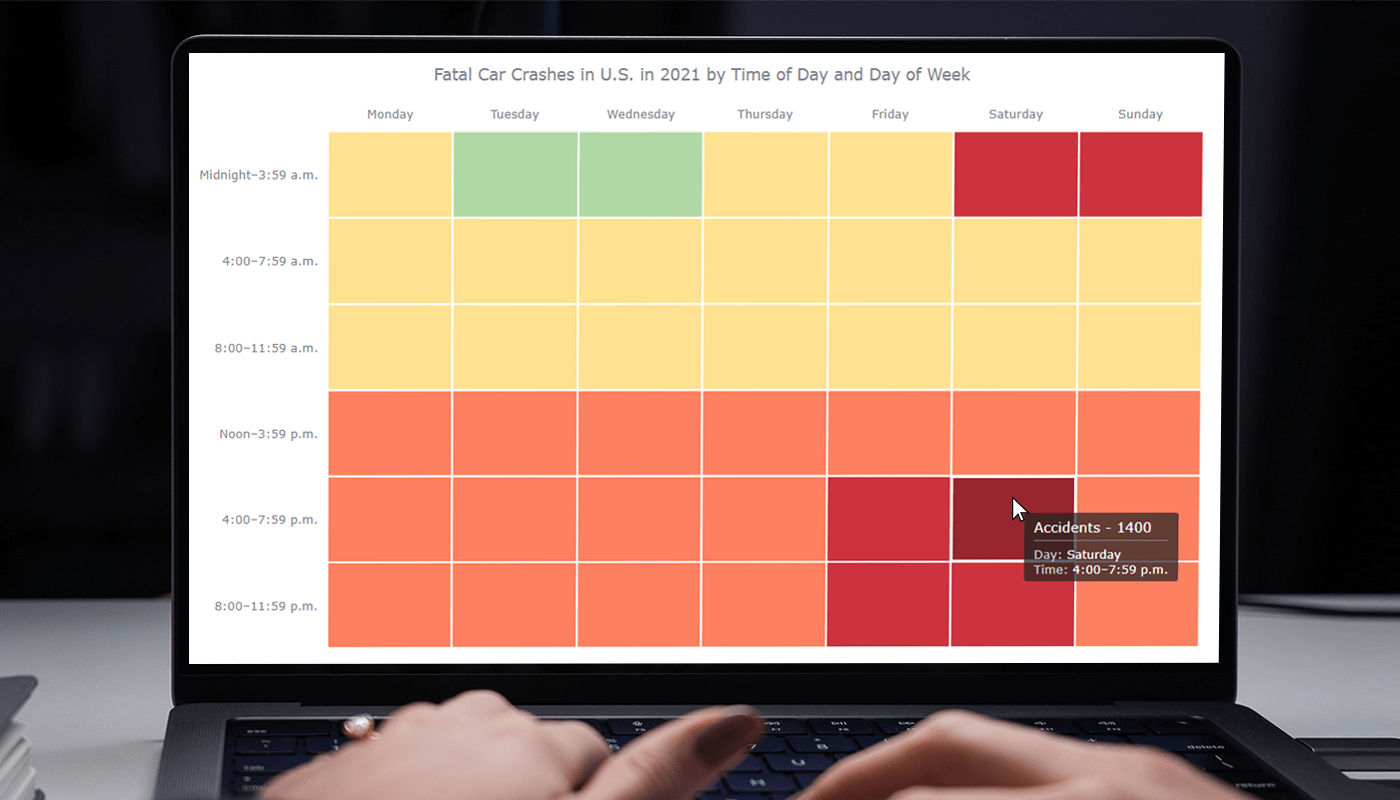
In the final version, I decided to ultimately remove the labels since the colors are quite indicative of the values.
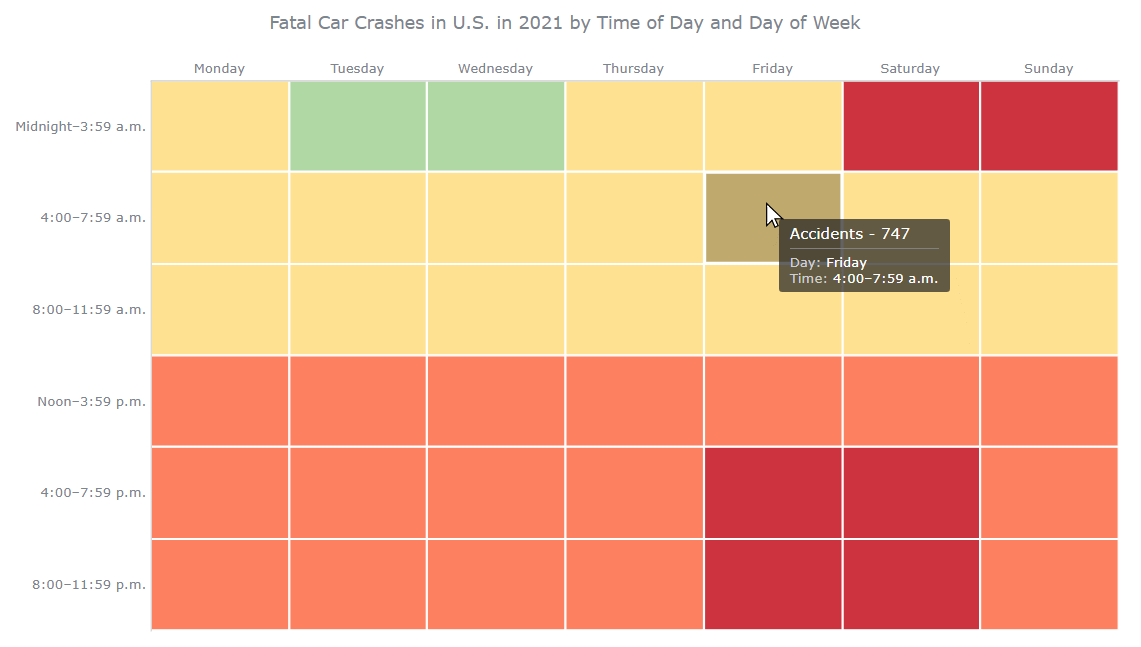
How to Format the Title and Tooltip
Now it's time to make our JS heatmap visualization even more exciting with some formatting tweaks.
First, we'll enable HTML for the tooltip, so we can customize it with some eye-catching formatting. We'll display the number of accidents in the heading and the day as well as the timing in the body of the tooltip. This will add more context and help the user to better understand the data.
chart.tooltip().title().useHtml(true);
chart
  .tooltip()
  .useHtml(true)
  .titleFormat(function () {
    return "Accidents - " + this.heat;
  })
  .format(function () {
    return (
      '<span style="color: #CECECE">Day: </span>' +
      this.x +
      "<br/>" +
      '<span style="color: #CECECE">Time: </span>' +
      this.y
    );
  });
Let’s also add a bit of padding under the main title to make it more spaced out and visually appealing:
chart
  .title()
  .enabled(true)
  .text("Fatal Car Crashes in U.S. in 2021 by Time of Day and Day of Week")
  .padding([0, 0, 20, 0]);
Here's what those modifcations look like:
How to Modify the Axes
For better readability, we can add padding between the axes labels and the chart tiles and remove the axes lines since the tiles form a boundary by themselves.
chart.xAxis().stroke(null);
chart.yAxis().stroke(null);
chart.yAxis().labels().padding([0, 10, 0, 0]);
chart.xAxis().labels().padding([0, 0, 10, 0]);
And there you have it! With just a few aesthetic changes, we've transformed a simple heatmap into a stunning visualization that really drives home a powerful message. You can check it out below with the full source code, and you can take a closer look at the interactive version of the heatmap and play with the code live here.
<html>
  <head>
    <title>Heatmap in JavaScript</title>
    <script src="https://cdn.anychart.com/releases/8.11.0/js/anychart-core.min.js"></script>
    <script src="https://cdn.anychart.com/releases/8.11.0/js/anychart-heatmap.min.js"></script>
    <style type="text/css">
      html, body, #container {
        width: 100%; margin: 0; padding: 0;
      }
    </style>
  </head>
  <body>
    <div id="container"></div>
    <script>
      anychart.onDocumentReady(function () {
        // create a heatmap
        var chart = anychart.heatMap(getData());
        // set a custom color scale
        var colorScale = anychart.scales.ordinalColor();
        colorScale.ranges([
          { less: 500, color: "#B0D8A4" },
          { from: 500, to: 900, color: "#FEE191" },
          { from: 900, to: 1300, color: "#FD8060" },
          { greater: 1300, color: "#CC333F" }
        ]);
        chart.colorScale(colorScale);
        // style the coloring in the hovered state
        chart
          .hovered()
          .fill(function () {
            return anychart.color.darken(this.sourceColor, 0.25);
          });
        // hide the labels
        chart.labels(false);
        // customize the axes
        chart.xAxis().stroke(null);
        chart.yAxis().stroke(null);
        chart.yAxis().labels().padding([0, 10, 0, 0]);
        chart.xAxis().labels().padding([0, 0, 10, 0]);
        // set the tooltip
        chart.tooltip().title().useHtml(true);
        chart
          .tooltip()
          .useHtml(true)
          .titleFormat(function () {
            return "Accidents - " + this.heat;
          })
          .format(function () {
            return (
              '<span style="color: #CECECE">Day: </span>' +
              this.x +
              "<br/>" +
              '<span style="color: #CECECE">Time: </span>' +
              this.y
            );
          });
        // name the heatmap
        chart
          .title()
          .enabled(true)
          .text("Fatal Car Crashes in U.S. in 2021 by Time of Day and Day of Week")
          .padding([0, 0, 20, 0]);
        // set the container for the heatmap
        chart.container("container");
        // draw the heatmap
        chart.draw();
      });
      // add the data
      function getData() {
        return [
          {
            x: "Monday",
            y: "Midnight–3:59 a.m.",
            heat: 705
          },
          {
            x: "Monday",
            y: "4:00–7:59 a.m.",
            heat: 713
          },
          {
            x: "Monday",
            y: "8:00–11:59 a.m.",
            heat: 657
          },
          {
            x: "Monday",
            y: "Noon–3:59 p.m.",
            heat: 957
          },
          {
            x: "Monday",
            y: "4:00–7:59 p.m.",
            heat: 1137
          },
          {
            x: "Monday",
            y: "8:00–11:59 p.m.",
            heat: 956
          },
          {
            x: "Tuesday",
            y: "Midnight–3:59 a.m.",
            heat: 482
          },
          {
            x: "Tuesday",
            y: "4:00–7:59 a.m.",
            heat: 641
          },
          {
            x: "Tuesday",
            y: "8:00–11:59 a.m.",
            heat: 631
          },
          {
            x: "Tuesday",
            y: "Noon–3:59 p.m.",
            heat: 905
          },
          {
            x: "Tuesday",
            y: "4:00–7:59 p.m.",
            heat: 1137
          },
          {
            x: "Tuesday",
            y: "8:00–11:59 p.m.",
            heat: 986
          },
          {
            x: "Wednesday",
            y: "Midnight–3:59 a.m.",
            heat: 465
          },
          {
            x: "Wednesday",
            y: "4:00–7:59 a.m.",
            heat: 616
          },
          {
            x: "Wednesday",
            y: "8:00–11:59 a.m.",
            heat: 627
          },
          {
            x: "Wednesday",
            y: "Noon–3:59 p.m.",
            heat: 914
          },
          {
            x: "Wednesday",
            y: "4:00–7:59 p.m.",
            heat: 1159
          },
          {
            x: "Wednesday",
            y: "8:00–11:59 p.m.",
            heat: 1066
          },
          {
            x: "Thursday",
            y: "Midnight–3:59 a.m.",
            heat: 584
          },
          {
            x: "Thursday",
            y: "4:00–7:59 a.m.",
            heat: 718
          },
          {
            x: "Thursday",
            y: "8:00–11:59 a.m.",
            heat: 660
          },
          {
            x: "Thursday",
            y: "Noon–3:59 p.m.",
            heat: 966
          },
          {
            x: "Thursday",
            y: "4:00–7:59 p.m.",
            heat: 1161
          },
          {
            x: "Thursday",
            y: "8:00–11:59 p.m.",
            heat: 1186
          },
          {
            x: "Friday",
            y: "Midnight–3:59 a.m.",
            heat: 715
          },
          {
            x: "Friday",
            y: "4:00–7:59 a.m.",
            heat: 747
          },
          {
            x: "Friday",
            y: "8:00–11:59 a.m.",
            heat: 738
          },
          {
            x: "Friday",
            y: "Noon–3:59 p.m.",
            heat: 1056
          },
          {
            x: "Friday",
            y: "4:00–7:59 p.m.",
            heat: 1426
          },
          {
            x: "Friday",
            y: "8:00–11:59 p.m.",
            heat: 1631
          },
          {
            x: "Saturday",
            y: "Midnight–3:59 a.m.",
            heat: 1383
          },
          {
            x: "Saturday",
            y: "4:00–7:59 a.m.",
            heat: 641
          },
          {
            x: "Saturday",
            y: "8:00–11:59 a.m.",
            heat: 635
          },
          {
            x: "Saturday",
            y: "Noon–3:59 p.m.",
            heat: 1034
          },
          {
            x: "Saturday",
            y: "4:00–7:59 p.m.",
            heat: 1400
          },
          {
            x: "Saturday",
            y: "8:00–11:59 p.m.",
            heat: 1593
          },
          {
            x: "Sunday",
            y: "Midnight–3:59 a.m.",
            heat: 1486
          },
          {
            x: "Sunday",
            y: "4:00–7:59 a.m.",
            heat: 695
          },
          {
            x: "Sunday",
            y: "8:00–11:59 a.m.",
            heat: 564
          },
          {
            x: "Sunday",
            y: "Noon–3:59 p.m.",
            heat: 932
          },
          {
            x: "Sunday",
            y: "4:00–7:59 p.m.",
            heat: 1292
          },
          {
            x: "Sunday",
            y: "8:00–11:59 p.m.",
            heat: 1211
          }
        ];
      }
    </script>
  </body>
</html>
Conclusion
In conclusion, data visualization is an incredibly powerful tool that can help us uncover important insights from our data. And with JavaScript, creating beautiful and impactful charts, such as a heatmap, can be a breeze.
So don't be afraid to experiment with different chart types, styles, and libraries to create your own hard-hitting visualizations. And above all, remember to stay safe out there on the roads!