

Chrome Lighthouse has been around for a while now, but what if I ask you to explain what it does can you explain vividly?
I discovered that a lot of web developers, including beginners, have not heard about this tool and those who have, have not tried it yet, that's not cool :(.
In this article, I would introduce you Chrome Lighthouse, what it does and how to start using it.
PS: This article was first published on my blog
Let’s get started :)
According to Wikipedia, A lighthouse is a tower, building, or other types of structure designed to emit light from a system of lamps and lenses and to serve as a navigational aid for maritime pilots at sea or on inland waterways.
Okay, let's turn this into a tech term;
Lighthouse is a tower, building, or other types of structure designed to emit light from a system under the “Audits” panel in Chrome Developer Tools and to serve as a guide for developers
Making any sense? :)
Well, Lighthouse is a tool developed by Google that analyzes web apps and web pages, collecting modern performance metrics and insights on developer best practices.
Think of Lighthouse as the speedometer in a car that checks and balances the cars speed limit.
Basically, Lighthouse works with developer best practices and performance metrics. It runs checks on a web app and gives you feedback on errors, practices below standard, tips for better performance and how to fix them.
According to Google Developers Docs
Lighthouse is an open-source, automated tool for improving the quality of web pages. You can run it against any web page, public or requiring authentication. It has audits for performance, accessibility, progressive web apps, and more.
You can run Lighthouse in Chrome DevTools, from the command line, or as a Node module. You give Lighthouse a URL to audit, it runs a series of audits against the page, and then it generates a report on how well the page did. From there, use the failing audits as indicators on how to improve the page. Each audit has a reference doc explaining why the audit is important, as well as how to fix it.
That’s pretty much all about Lighthouse, It audits the URL of a web app and generates a report telling you how bad and good your web app is according to web standards and developers best practices. Also attached to each section of the report is documentation explaining why that part of your app was audited, why you should improve that part of your app and how to fix it.
Here is a demo of Lighthouse audits report for this blog https://bolajiayodeji.com
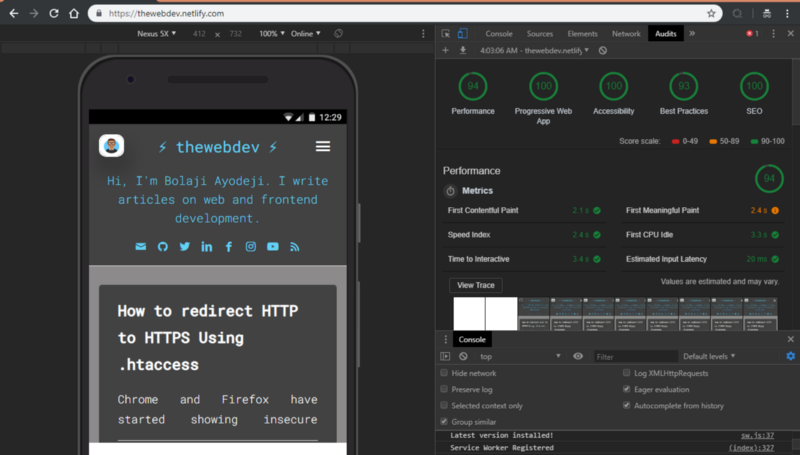
L: My blog :) R: Lighthouse audits report
Pretty cool right? :)
What you should note is that I didn’t get great scores like this on my first audit. I had to use my first report to fix and improve the performance and quality of my app.
This is the idea behind Lighthouse, it is to identify and fix common problems that affect your sites performance, accessibility and user experience.
Now, let's move to the interesting part, HOW TO GET STARTED!!
LightHouse is available in three workflows
Chrome Developer Tools
Command line (Node)
A Chrome extension
I personally prefer using LightHouse in Dev Tools. Using the extension does not make sense as the Dev Tool and extension work in the same chrome browser, well our preference varies, use what works best for you.
Lighthouse was first available only with the Chrome extension before it was added to the Chrome DevTools.
Using lighthouse on the command line is really cool also,(For geeks :))
Let’s Get Started!!!
[1] Run Lighthouse in Chrome DevTools
- Download Google Chrome web browser here
Note that Lighthouse can only be run on a desktop and not mobile
- Go to the URL you want to audit in Google Chrome.
You can audit any URL on the web.
- Open Chrome DevTools
Command+Option+C (Mac)
Control+Shift+C (Windows, Linux, Chrome OS).
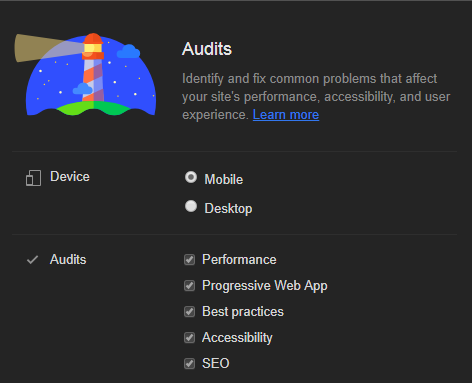
- Click on the Audits panel
To the left is the viewport of the page that will be audited, here that’s my blog :). To the right is the Audits panel of Chrome DevTools, which is now powered by Lighthouse
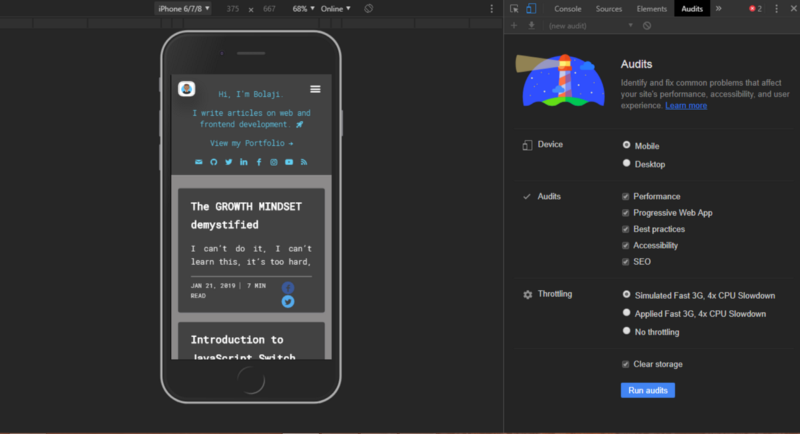
- Click on Run audits
DevTools shows you a list of audit categories. Ensure that you leave them all checked. If you want to personalise what part of your app to be audited, you can set that by checking the categories you want to audit.
- After 60 to 90 seconds — depending on your internet strength, Lighthouse gives you a report on the page.
Not that your internet speed and pre installed extensions can affect lighthouse audits. For better experience, run audits in Icognito mode to avoid any interference
[2] Run Lighthouse in Command line
Download Google Chrome web browser here
Download node here, If you have it installed already, skip this step!
Install Lighthouse
npm install -g lighthouse
# or use yarn:
yarn global add lighthouse
The
-gflag installs it as a global module.
- Run your audits
lighthouse <url>
Sample;
lighthouse https://bolajiayodeji.com/
By default, Lighthouse writes the report to an HTML file. You can control the output format by passing flags.
The report can be displayed in HTML or JSON format
Output samples:
lighthouse
# saves `./<HOST>_<DATE>.report.html`

lighthouse --output json
# json output sent to stdout

lighthouse --output html --output-path ./report.html
# saves `./report.html`

# NOTE: specifying an output path with multiple formats ignores your specified extension for *ALL* formats
lighthouse --output json --output html --output-path ./myfile.json
# saves `./myfile.report.json` and `./myfile.report.html`

lighthouse --output json --output html
# saves `./<HOST>_<DATE>.report.json` and `./<HOST>_<DATE>.report.html`

lighthouse --output-path=~/mydir/foo.out --save-assets
# saves `~/mydir/foo.report.html`
# saves `~/mydir/foo-0.trace.json` and `~/mydir/foo-0.devtoolslog.json`

lighthouse --output-path=./report.json --output json
# saves `./report.json`
Run $ lighthouse --help for CLI options
[3] Run Lighthouse with the Chrome extension
As I earlier said, The DevTools workflow is the best as it provides the same benefits as the Extension workflow, with the added bonus of no installation needed.
To use this method you need to install the extension, but If you have your reasons, here is the guide;
Download Google Chrome web browser here
Install the Lighthouse Chrome Extension from the Chrome Webstore.
Navigate to the page you want to audit
Click Lighthouse Icon.
It should be next to the Chrome address bar. If not, open Chrome’s main menu (the three dots on the upper right) and access it at the top of the menu. After clicking, the Lighthouse menu expands.
- Click Generate report.
Lighthouse runs its audits against the opened page, then opens up a new tab with a report of the results.
Bingo! You did it
That’s pretty much it, Lighthouse is a great tool, especially for beginners.
It is a very useful tool when it comes to auditing Progressive web apps.
I actually learned so much about optimization and performance standards when I started using Lighthouse. In no time you would become an expert in building full optimized web apps with great performance, accessibility and user experience. :)
Lighthouse is not magic, it was created by humans. It is open source and contributions are welcome. Check out the repository’s issue tracker to find bugs that you can fix, or audits that you can create or improve upon. The issues tracker is also a good place to discuss audit metrics, ideas for new audits, or anything else related to Lighthouse.
Thank you for reading this, after installing and using Lighthouse, share your success stories in the comments!
Also, I just launched my blog where I write articles on web and frontend development, don’t forget to visit and share!!!