

K-means clustering is a powerful technique that can help you discover hidden patterns and groupings in your datasets. Let’s look at how it works.
K-means clustering is a basic but powerful tool in data science. It has changed the way we look at and understand large datasets.
In this article, we’ll learn about what K-means clustering is, how it works, what it’s used for, and some problems it might have. This guide is helpful and easy to understand, whether you’re learning about data science or just interested in it.
Basics of Clustering
Clustering is a way to put similar data points into groups. It helps us find patterns and shapes in data, which is very useful in areas like marketing and biology.
It’s a type of ‘unsupervised learning’, meaning the data forms its own groups without us knowing the answers beforehand.
There are many types of clustering methods like Hierarchical, Density-based, Distribution-based, and Partitioning methods. K-means falls into the category of “partitioning methods”.
What is K-Means Clustering?
K-means clustering is a way to split data into groups, or ‘clusters’.
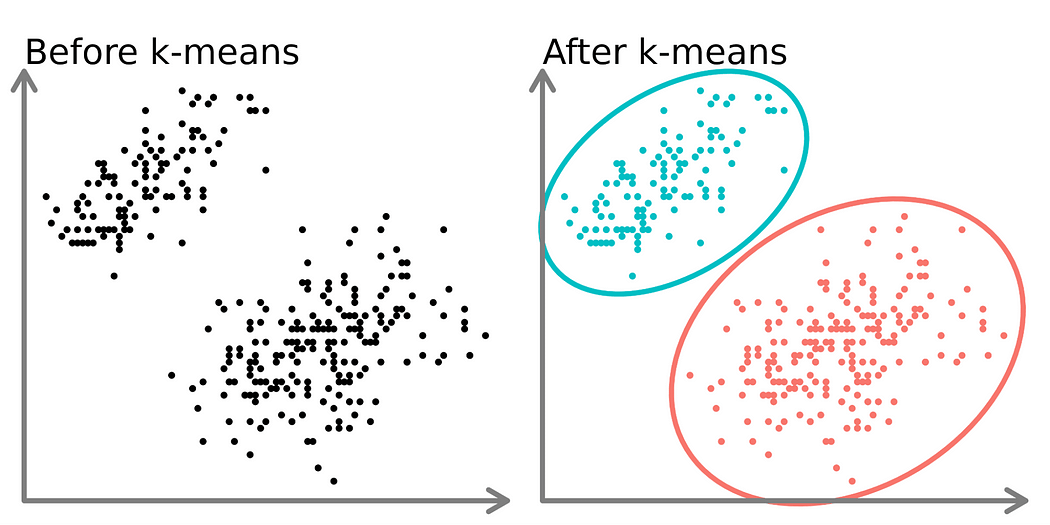 Image of graphs depicting data points before and after k-means clustering
We decide how many groups we want, called ‘K’. The aim is to make items in each group as similar as possible while making the groups different from each other.
K-means usually makes groups that are about the same size. This is different from hierarchical clustering, which can make groups of different sizes.
How the K-means Algorithm Works
K-means is popular because it’s a simple yet smart way of clustering data. Here’s how it works.
A cluster is a group of data points that are grouped together because they are similar. You will choose a number, k, which is the number of central points, called centroids, that you want in your data.
A centroid is a central spot that stands in the middle of a cluster. Each data point is placed into one of these clusters. This is done by minimizing the total distance within each cluster.
In simple terms, the K-means algorithm picks k centroids, and then assigns each data point to the closest cluster. The goal is to keep these central points, or centroids, as close together as possible.
Here, the term ‘means’ in K-means is about finding the average or the centroid of the data.
Here is a step by step approach:
- Pick the Number of Groups (K): First, decide how many groups you want, called ‘K’. You can choose this based on what you know or use methods like the elbow method.
- Start with Centroids: Choose K points from your data randomly as starting points, called centroids.
- Group Data Points: Put each point in your data into the nearest group, based on how close it is to the centroids.
- Update Centroids: Change each group’s centre point to the average of all the points in that group.
- Keep Going Until It’s Just Right: Repeat steps 3 and 4 until the groups don’t change any more.
Picking the right number for K is important. If you have too many groups, it might get too complicated. If you have too few, it might be too simple.
If you want to see how this works in code, here is a simple example:
from sklearn.cluster import KMeans
import matplotlib.pyplot as plt
import numpy as np

# Step 1: Generate random data
np.random.seed(0)
x = -2 * np.random.rand(100, 2)  # Generate random points around (-2, -2)
x1 = 1 + 2 * np.random.rand(50, 2)  # Generate random points around (3, 3)
x[50:100, :] = x1  # Combine the two sets of points

# Step 2: Visualize the data (unclustered)
plt.scatter(x[:, 0], x[:, 1], s=50, c='b')
plt.xlabel('X Axis')
plt.ylabel('Y Axis')
plt.show()

# Step 3: Apply KMeans clustering
kmeans = KMeans(n_clusters=2)  # Initialize KMeans with 2 clusters
kmeans.fit(x)  # Fit the model to the data

# Step 4: Get the coordinates of the cluster centers and the cluster labels
centroids = kmeans.cluster_centers_  # Centroids of the clusters
labels = kmeans.labels_  # Labels of each point

# Step 5: Visualize the clustered data
plt.scatter(x[:, 0], x[:, 1], s=50, c=labels, cmap='viridis')  # Plot data points with cluster color
plt.scatter(centroids[:, 0], centroids[:, 1], s=200, c='red', marker='*')  # Plot centroids
plt.xlabel('X Axis')
plt.ylabel('Y Axis')
plt.title('K-Means Clustering')
plt.show()
Here is the final result after clustering.
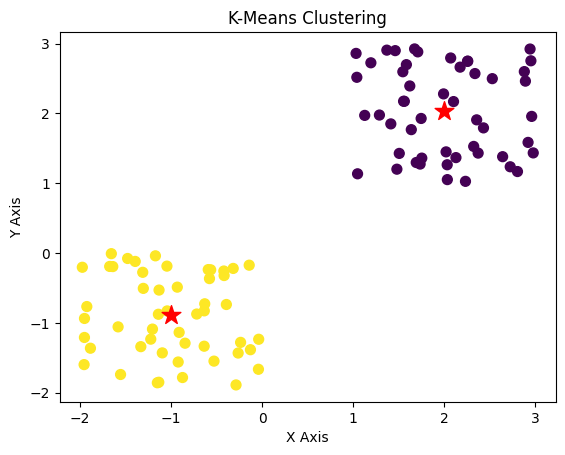 K-means clustering
Where Do We Use K-Means Clustering?
K-means clustering is used in many areas. Let’s look at a few of them:
Market Segmentation
K-means clustering is a tool businesses use to learn about their customers. It groups customers by purchases, interests, or location.
It is useful in retail and e-commerce for making smart marketing strategies along with recommending similar products products. A good example is Amazon’s suggestions of related items after you make a purchase.
This method makes customer service and product promotion more effective. It helps businesses tailor their offerings to different customer needs, improving sales and customer satisfaction.
Image Compression and Processing
The K-means algorithm is important for working with digital images, especially when it comes to making them smaller. It does this by by grouping similar colours together and replacing them with a single colour.
When there are fewer colours, the image file becomes smaller, which saves storage space and makes it easier to send and use the image. This process doesn’t just make the image file smaller – it also makes the image simpler for computers to analyze.
This colour reduction is helpful in areas like medical imaging. Doctors often use detailed scans like MRIs to diagnose and treat illnesses. These scans show lots of tiny details, and sometimes there’s too much information. By using K-means to simplify the image, doctors can more easily see the important parts.
Document Clustering for Information Retrieval
K-means clustering can help manage piles of online information. It works by putting similar documents into groups. This is useful for search engines, digital libraries and other large scale document databases.
Imagine an online library with millions of articles. K-means can help by sorting these articles into related clusters. This can help search engines search for relevant content quickly instead of going through every single article in the database.
When you’re looking for something specific, K-means makes it easier and faster to find.
Anomaly Detection in Network Security
In network security, K-means clustering is like a smart guard. It helps security teams by spotting unusual patterns in data traffic that could be signs of threats.
Here’s how it works: Normally, data in a network has a regular pattern. K-means looks at all this data and groups it based on these patterns. But sometimes, something strange pops up — like unexpected spikes in traffic or odd data movements. These could be clues to security risks, like hacking attempts.
K-means is great at quickly finding these odd patterns. It flags data that doesn’t fit into usual groups. Security teams can then check these flags to see if they’re real dangers. This quick spotting is crucial because in network security, responding fast can prevent a lot of damage.
Genome research
K-means clustering is a useful tool in gene research, especially for medical studies. It sorts genes into groups that act similarly and helps to understand genes better.
This grouping is valuable in personalized medicine which looks at a person’s unique genes to decide on the best treatment. K-means helps by showing which genes are alike. This way, doctors can understand the treatments that will work well for someone based on their genes.
So, K-means is not just about grouping genes. It’s a key part of making medicine that’s just right for each person. It helps doctors choose treatments that match a person’s genetic details, which is a big step forward in healthcare.
Conclusion
K-means clustering is a powerful method for uncovering patterns in data. By grouping similar items, it helps in making data-driven decisions in various fields.
While it has its limitations, its ease of use and effectiveness make it a go-to method for exploratory data analysis. Whether you’re a seasoned data scientist or a curious beginner, delving into k-means clustering can open up new perspectives and insights into your data.
Thanks for reading this article. You can learn more at https://manishmshiva.com.