

The K-Nearest Neighbors (K-NN) algorithm is a popular Machine Learning algorithm used mostly for solving classification problems.
In this article, you'll learn how the K-NN algorithm works with practical examples.
We'll use diagrams, as well sample data to show how you can classify data using the K-NN algorithm. We'll also discuss the advantages and disadvantages of using the algorithm.
How Does the K-Nearest Neighbors Algorithm Work?
The K-NN algorithm compares a new data entry to the values in a given data set (with different classes or categories).
Based on its closeness or similarities in a given range (K) of neighbors, the algorithm assigns the new data to a class or category in the data set (training data).
Let's break that down into steps:
Step #1 - Assign a value to K.
Step #2 - Calculate the distance between the new data entry and all other existing data entries (you'll learn how to do this shortly). Arrange them in ascending order.
Step #3 - Find the K nearest neighbors to the new entry based on the calculated distances.
Step #4 - Assign the new data entry to the majority class in the nearest neighbors.
Don't worry if the steps above seem confusing at the moment. The examples in the sections that follow will help you understand better.
K-Nearest Neighbors Classifiers and Model Example With Diagrams
With the aid of diagrams, this section will help you understand the steps listed in the previous section.
Consider the diagram below:
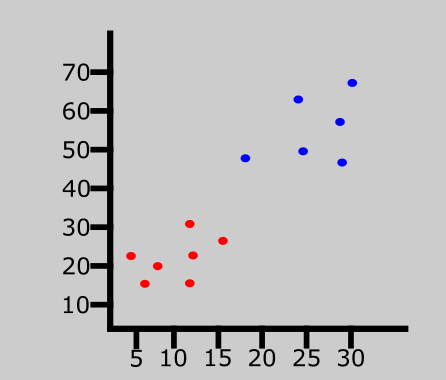
The graph above represents a data set consisting of two classes — red and blue.
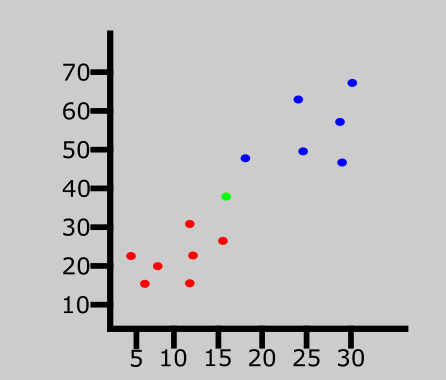
A new data entry has been introduced to the data set. This is represented by the green point in the graph above.
We'll then assign a value to K which denotes the number of neighbors to consider before classifying the new data entry. Let's assume the value of K is 3.
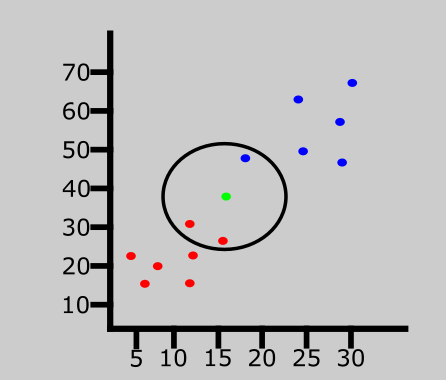
Since the value of K is 3, the algorithm will only consider the 3 nearest neighbors to the green point (new entry). This is represented in the graph above.
Out of the 3 nearest neighbors in the diagram above, the majority class is red so the new entry will be assigned to that class.

The last data entry has been classified as red.
K-Nearest Neighbors Classifiers and Model Example With Data Set
In the last section, we saw an example the K-NN algorithm using diagrams. But we didn't discuss how to know the distance between the new entry and other values in the data set.
In this section, we'll dive a bit deeper. Along with the steps followed in the last section, you'll learn how to calculate the distance between a new entry and other existing values using the Euclidean distance formula.
Note that you can also calculate the distance using the Manhattan and Minkowski distance formulas.
Let's get started!
| Brightness | Saturation | Class |
| 40 | 20 | Red |
| 50 | 50 | Blue |
| 60 | 90 | Blue |
| 10 | 25 | Red |
| 70 | 70 | Blue |
| 60 | 10 | Red |
| 25 | 80 | Blue |
The table above represents our data set. We have two columns — Brightness and Saturation. Each row in the table has a class of either Red or Blue.
Before we introduce a new data entry, let's assume the value of K is 5.
How to Calculate Euclidean Distance in the K-Nearest Neighbors Algorithm
Here's the new data entry:
| Brightness | Saturation | Class |
| 20 | 35 | ? |
We have a new entry but it doesn't have a class yet. To know its class, we have to calculate the distance from the new entry to other entries in the data set using the Euclidean distance formula.
Here's the formula: √(X₂-X₁)²+(Y₂-Y₁)²
Where:
- X₂ = New entry's brightness (20).
- X₁= Existing entry's brightness.
- Y₂ = New entry's saturation (35).
- Y₁ = Existing entry's saturation.
Let's do the calculation together. I'll calculate the first three.
Distance #1
For the first row, d1:
| Brightness | Saturation | Class |
| 40 | 20 | Red |
d1 = √(20 - 40)² + (35 - 20)²
= √400 + 225
= √625
= 25
We now know the distance from the new data entry to the first entry in the table. Let's update the table.
| Brightness | Saturation | Class | Distance |
| 40 | 20 | Red | 25 |
| 50 | 50 | Blue | ? |
| 60 | 90 | Blue | ? |
| 10 | 25 | Red | ? |
| 70 | 70 | Blue | ? |
| 60 | 10 | Red | ? |
| 25 | 80 | Blue | ? |
Distance #2
For the second row, d2:
| Brightness | Saturation | Class | Distance |
| 50 | 50 | Blue | ? |
d2 = √(20 - 50)² + (35 - 50)²
= √900 + 225
= √1125
= 33.54
Here's the table with the updated distance:
| Brightness | Saturation | Class | Distance |
| 40 | 20 | Red | 25 |
| 50 | 50 | Blue | 33.54 |
| 60 | 90 | Blue | ? |
| 10 | 25 | Red | ? |
| 70 | 70 | Blue | ? |
| 60 | 10 | Red | ? |
| 25 | 80 | Blue | ? |
Distance #3
For the third row, d3:
| Brightness | Saturation | Class | Distance |
| 60 | 90 | Blue | ? |
d2 = √(20 - 60)² + (35 - 90)²
= √1600 + 3025
= √4625
= 68.01
Updated table:
| Brightness | Saturation | Class | Distance |
| 40 | 20 | Red | 25 |
| 50 | 50 | Blue | 33.54 |
| 60 | 90 | Blue | 68.01 |
| 10 | 25 | Red | ? |
| 70 | 70 | Blue | ? |
| 60 | 10 | Red | ? |
| 25 | 80 | Blue | ? |
At this point, you should understand how the calculation works. Attempt to calculate the distance for the last four rows.
Here's what the table will look like after all the distances have been calculated:
| Brightness | Saturation | Class | Distance |
| 40 | 20 | Red | 25 |
| 50 | 50 | Blue | 33.54 |
| 60 | 90 | Blue | 68.01 |
| 10 | 25 | Red | 10 |
| 70 | 70 | Blue | 61.03 |
| 60 | 10 | Red | 47.17 |
| 25 | 80 | Blue | 45 |
Let's rearrange the distances in ascending order:
| Brightness | Saturation | Class | Distance |
| 10 | 25 | Red | 10 |
| 40 | 20 | Red | 25 |
| 50 | 50 | Blue | 33.54 |
| 25 | 80 | Blue | 45 |
| 60 | 10 | Red | 47.17 |
| 70 | 70 | Blue | 61.03 |
| 60 | 90 | Blue | 68.01 |
Since we chose 5 as the value of K, we'll only consider the first five rows. That is:
| Brightness | Saturation | Class | Distance |
| 10 | 25 | Red | 10 |
| 40 | 20 | Red | 25 |
| 50 | 50 | Blue | 33.54 |
| 25 | 80 | Blue | 45 |
| 60 | 10 | Red | 47.17 |
As you can see above, the majority class within the 5 nearest neighbors to the new entry is Red. Therefore, we'll classify the new entry as Red.
Here's the updated table:
| Brightness | Saturation | Class |
| 40 | 20 | Red |
| 50 | 50 | Blue |
| 60 | 90 | Blue |
| 10 | 25 | Red |
| 70 | 70 | Blue |
| 60 | 10 | Red |
| 25 | 80 | Blue |
| 20 | 35 | Red |
How to Choose the Value of K in the K-NN Algorithm
There is no particular way of choosing the value K, but here are some common conventions to keep in mind:
- Choosing a very low value will most likely lead to inaccurate predictions.
- The commonly used value of K is 5.
- Always use an odd number as the value of K.
Advantages of K-NN Algorithm
- It is simple to implement.
- No training is required before classification.
Disadvantages of K-NN Algorithm
- Can be cost-intensive when working with a large data set.
- A lot of memory is required for processing large data sets.
- Choosing the right value of K can be tricky.
Summary
In this article, we talked about the K-Nearest Neighbors algorithm. It is often used for classification problems.
We saw an example using diagrams to explain how the algorithms works.
We also saw an example using sample data to see the steps involved in classifying a new data entry.
Lastly, we discussed the advantages and disadvantages of the algorithm, and how you can choose the value of K.
Happy coding!