

In this post, you will learn about the single most important and useful tool in Computer Networks – Wireshark.
This post relies on basic knowledge of computer networks. Be sure to check my previous post about the five layers model if you need a refresher.
What is Wireshark?
Wireshark is a sniffer, as well as a packet analyzer.
What does that mean?
You can think of a sniffer as a measuring device. We use it to examine what’s going on inside a network cable, or in the air if we are dealing with a wireless network. A sniffer shows us the data that passes through our network card.
But Wireshark does more than that. A sniffer could just display a stream of bits - ones and zeroes, that the network card sees. Wireshark is also a packer analyzer that displays lots of meaningful data about the frames that it sees.
Wireshark is an open-source and free tool, and is widely used to analyze network traffic.
Wireshark can be helpful in many cases. It might be helpful for debugging problems in your network, for instance – if you can’t connect from one computer to another, and want to understand what’s going on.
It can also help programmers. For example, imagine that you were implementing a chat program between two clients, and something was not working. In order to understand what exactly is being sent, you may use Wireshark to see the data transmitted over the wire.
So, let’s get to know Wireshark.
How to Download and Install Wireshark
Start by downloading Wireshark from its official website:
https://www.wireshark.org/#download
Follow the instructions on the installer and you should be good to go.
How to Sniff Traffic with Wireshark
Launch Wireshark, and start by sniffing some data. For that, you can hit Ctrl+K (PC) or Cmd+K (Mac) to get the Capture Options window. Notice that you can reach this window in other ways. You can go to Capture->Options. Alternatively, you can click the Capture Options icon.
I encourage you to use keyboard shortcuts and get comfortable with them right from the start, as they'll allow you to save time and work more efficiently.
So, again, I’ve used Ctrl+K (or Cmd+K) and got this screen:
 The
The Capture Options window in Wireshark (Source: Brief)
Here we can see a list of interfaces, and I happen to have quite a few. Which one is relevant? If you’re not sure at this point, you can look at the Traffic column, and see which interfaces currently have traffic.
Here we can see that Wi-Fi 3 has got traffic going through it, as the line is high. Select the relevant network interface, and then hit Enter, or click the button Start.
Let Wireshark sniff the network for a bit, and then stop the sniff using Ctrl+E / Cmd+E. Again, this can be achieved in other ways – such as going to Capture->Stop or clicking the Stop icon.
Consider the different sections:
 Wireshark's sections (Source: Brief)
The section marked in red includes Wireshark’s menu, with all kinds of interesting options.
The main toolbar is marked in blue, providing quick access to some items from the menu.
Next, marked in green, is the display filter. We will get back to it shortly, as this is one of the most important features of Wireshark.
Then follows:
The Packet List Pane
The packet list pane is marked in orange. It displays a short summary of each packet captured.
(Note: the term Frame belongs to a sequence of bytes in the Data Link layer, while a Packet is a sequence of bytes from the Network layer. In this post I will use the terms interchangeably, though to be accurate, every packet is a frame, but not every frame is a packet, as there are frames that don't hold network layer data.)
As you can see in the image above, we have a few columns here:
NUMBER (No.) – The number of the packet in the capture file. This number won’t change, even if we use filters. This is just a sequential number – the first frame that you have sniffed gets the number 1, the second frame gets the number 2, and so on.
Time – The timestamp of the packet. It shows how much time has passed from the very first packet we have sniffed until we sniffed the packet in question. Therefore, the time for packet number 1 is always 0.
Source – The address where this packet is coming from. Don’t worry if you don’t understand the format of the addresses just yet, we will cover different addresses in future tutorials.
Destination – The address where this packet is going.
Protocol – The protocol name in a short version. This will be the top protocol – that is, the protocol of the highest layer.
Length – The length of each packet, in bytes.
Info – Additional information about the packet content. This changes according to the protocol.
By clicking on packets in this pane, you control what is displayed in the other two panes which I will now describe.
The Packet Details Pane
Click on one of the captured packets. In the example below I clicked on packet number 147:
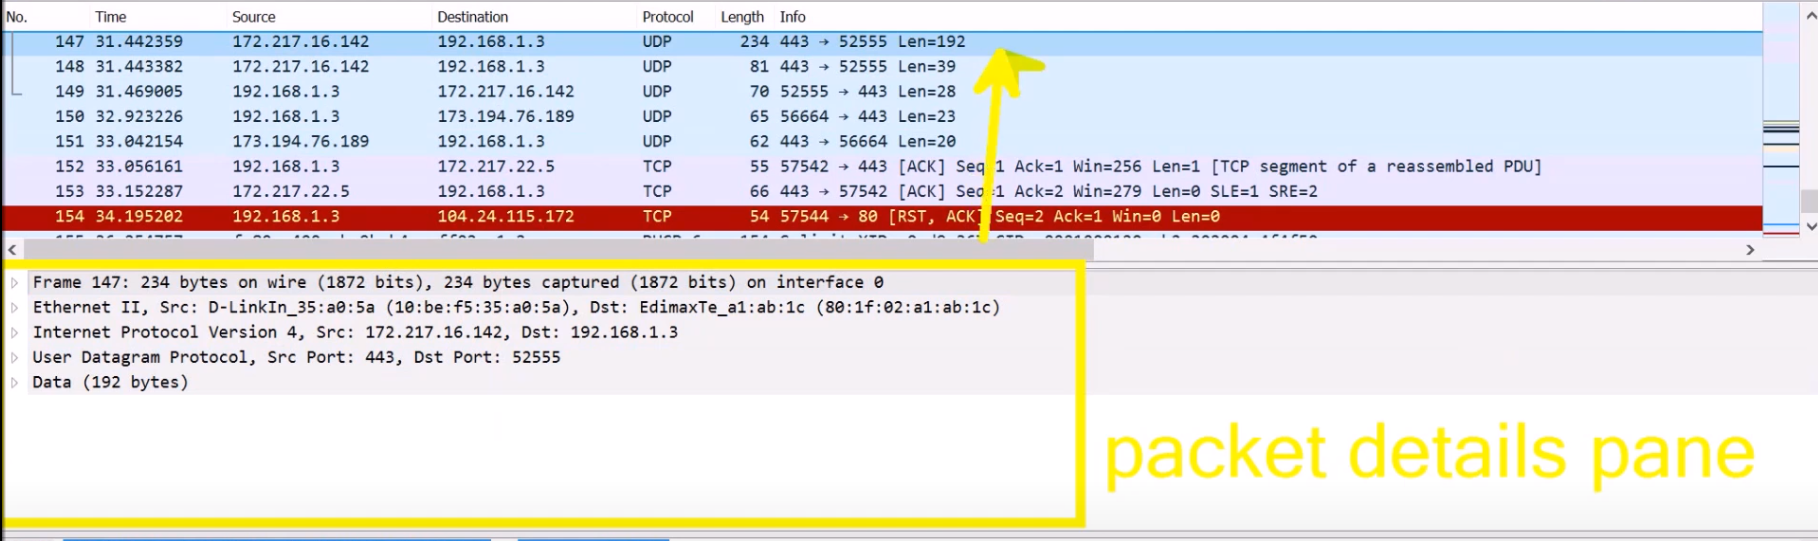 Selecting a specific packet changes the packet details pane (Source: Brief)
Now, the packet details pane displays the packet selected in the packet list pane in more detail. You can see the layers here.
In the example above, we have Ethernet II as the second layer, IPv4 as the third layer, UDP as the fourth layer, and some data as a payload.
When we click on a specific layer, we actually see the header of that layer.
Notice that we don’t see the first layer on its own. As a reminder, the first layer is responsible for transmitting a single bit – 0 or 1 – over the network (if you need a refresher about the different layers, check out this post).
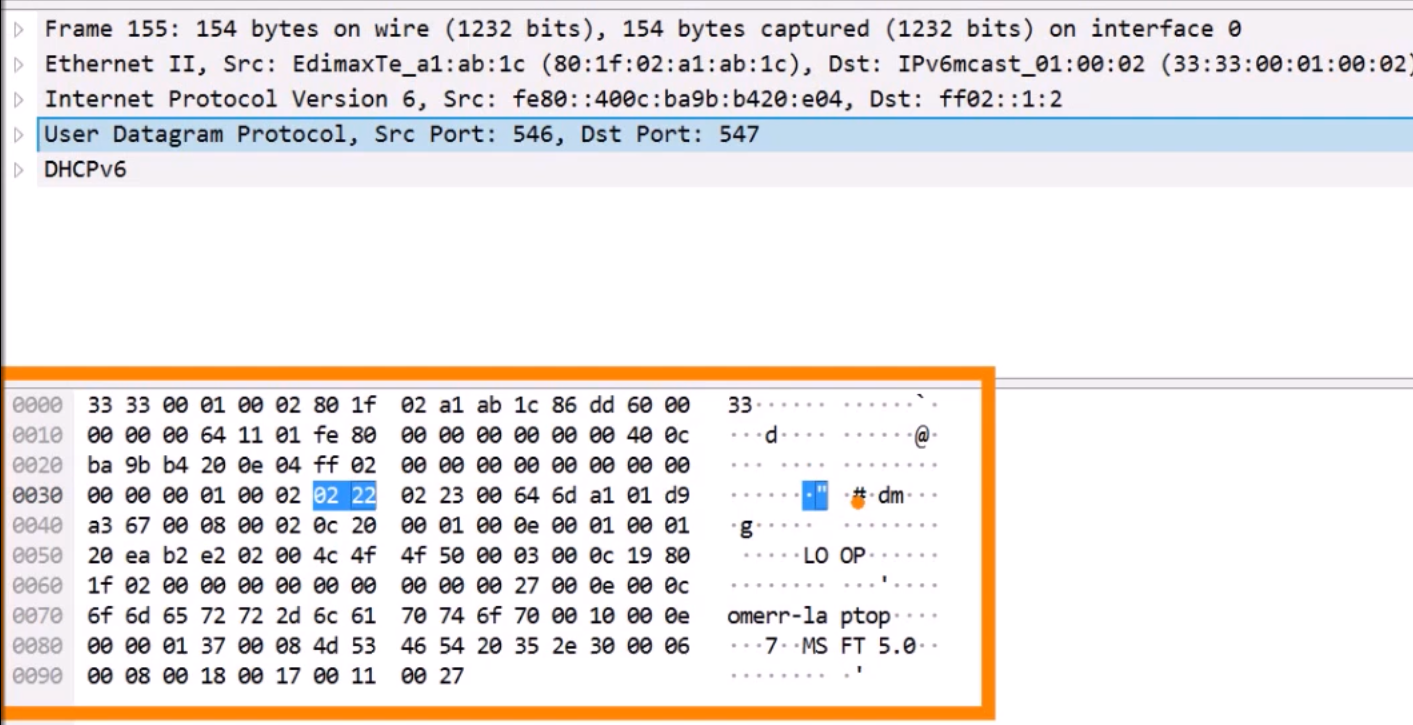 The packet bytes pane in Wireshark (Source: Brief)
Below the packet details pane, we have the packet bytes pane. It displays the data from the packet selected in the packet list pane. This is the actual data being sent over the wire. We can see the data in hexadecimal base, as well as ASCII form.
How to Use the Display Filter
Wireshark has many different functions, and today we will focus on one thing – the display filter.
As you can see, once you start sniffing data, you get a LOT of traffic. But you definitely don’t want to look at everything.
Recall the example from before – using Wireshark in order to debug a chat program that you’ve implemented. In that case, you would like to see the traffic related to the chat program only.
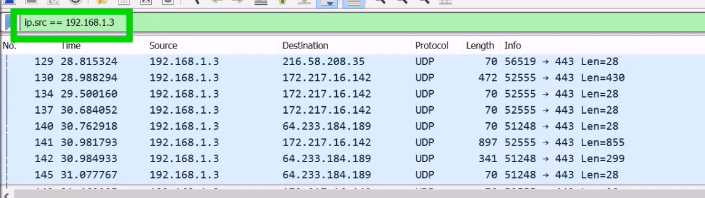
Let’s say I want to filter only messages sent by the source address of frame number 149 ( 192.168.1.3 ). I will cover IP addresses in future posts, but for now you can see that it consists four numbers, delimited by a dot:
 The
The display filter in Wireshark (Source: Brief)
Now, even if you don’t know how to filter only packets sent from this IP address, you can use Wireshark to show you how it’s done.
For that, go to the right field we would like to filter – in this case, the source IP address. Then right click -> and choose filter -> Apply as Filter.
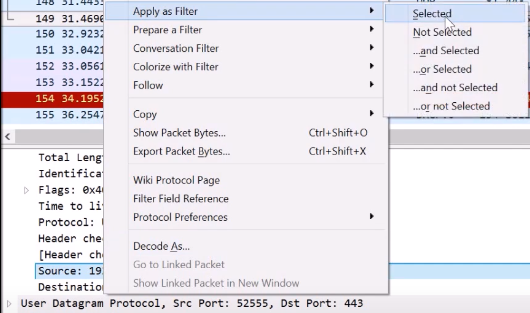 Applying a display filter (Source: Brief)
After applying the filter, you only see packets that have been sent from this address. Also, you can look at the display filter line and see the command used. In this way, you can learn about the display filter syntax (in this example, it is ip.src for the IP source address field):
 Applying a display filter (Source: Brief)
Now, try to filter only packets that have been sent from this address, and to the address 172.217.16.142 (as in Frame 130 in the image above). How would you do that?
Well, you could go to the relevant field – in this case, the IP destination address. Now, right click -> Apply as Filter -> and select ...and Selected:
 Applying a display filter (Source: Brief)
If you look at the display filter line after applying this filter:
 Applying a display filter (Source: Brief)
You can also learn that you can use the && operand in order to perform and. You could also write the word and, instead, and get the same result.
 Applying multiple conditions using
 && or and (Source: Brief)
How to Use Wireshark to Research the Ping Utility
Ping is a useful utility to check for remote servers’ connectivity.
This page explains how to use ping in Windows, and this page explains how to do that in OSX.
Now, we can try to ping <address> using the command line. By default, ping sends 4 requests and waits for a pong answer. If we want it to send a single request, we could use -n 1:
 Using the command line to ping Google (Source: Brief)
You can see that Google has responded. The time it took for the message to return was 92 milliseconds. We will learn about the meaning of TTL in future posts.
Ping is useful to determine whether a remote service is available, and how fast it is to reach that service. If it takes a very long time to reach a reliable server such as google.com, we might have a connectivity problem.
Try it yourself
Now, try to use Wireshark to answer the following questions:
1) What protocol does the ping utility use?
2) Using only Wireshark, compute the RTT (Round Trip Time) – how long it took since your ping request was sent and until the ping reply was received?
Next, run the following command:
ping -n 1 -l 342 www.google.com
3) What is the main difference between the packet sent by this command, and the packet sent by the previous command? Where in Wireshark can you see this difference, inspecting the packets?
4) What is the content (data) provided in the ping request packet? What is the content provided in the ping response packet?
Let's solve it together
So the first question is:
What protocol does the ping utility use?
To answer that question, start sniffing in Wireshark, and simply run the ping command. Stop the sniff, and consider the packets pane:
 Sniffing while running ping (source: Brief)
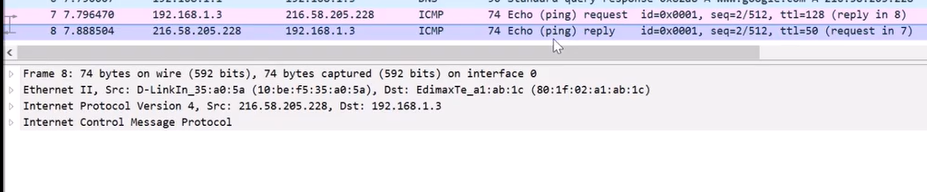
Wireshark marks the packets as Echo (ping) request and Echo (ping) reply.
Considering these packets, we can see they consist of Ethernet for the Data Link layer (though that may differ from one network to another), IPv4 as the Network layer, and then ICMP as the protocol for Ping itself. So the answer we found is: ICMP.
Next question:
Using only Wireshark, compute the Round Trip Time
Looking at the captured packets, we can see the Time column, and subtract the time of the Pong packet ( 7.888... ) from the time of the Ping packet ( 7.796...).
So in this case the RTT was: 92 ms. Of course, the value can be different when you run the ping utility.
What is the main difference between the packet sent by this command, and the packet sent by the previous command?
For question number 3, we are asked to run the following command:
ping -n 1 -l 342 www.google.com
Looking at the first run of ping, we can see the length of the packets are 74 bytes:
Sniffing while running ping (source: Brief)
Observing the packets sent after running ping with the -l 342 argument, we can see that the value is bigger:
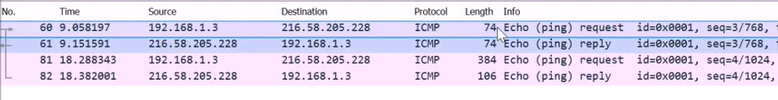 Sniffing while running ping (source: Brief)
So the main difference is the amount of bytes sent as the data.
Question number four:
What is the content (data) provided in the ping request packet?
What is the content provided in the ping response packet?
Click on the request packet to observe the data sent:
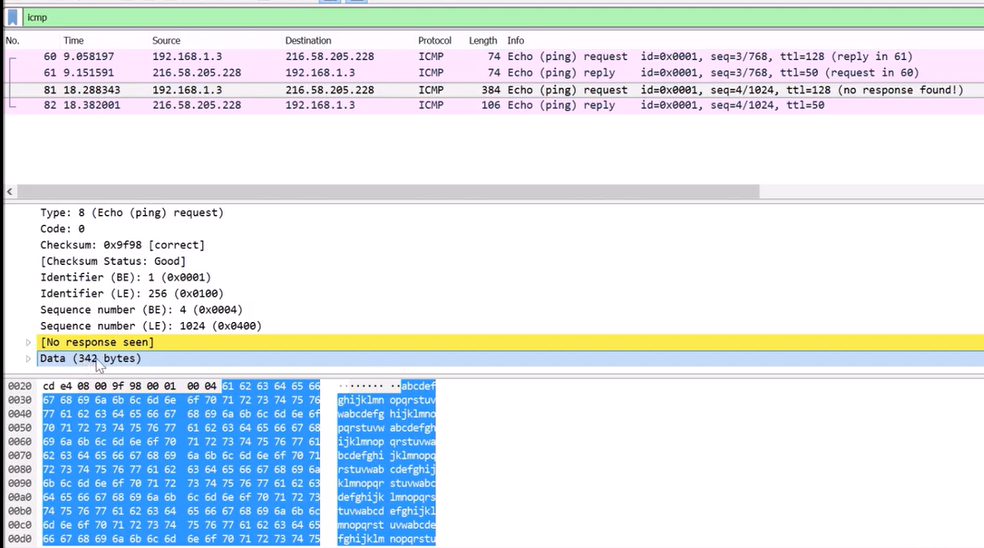 Observing the data sent by the
 ping utility (source: Brief)
The answer for the ping request is a through w, over and over again.
Regarding the ping response – it is the same as the request.
Summary
Wireshark is a wonderful tool for anyone working with Computer Networks. It can help you understand how protocols work and also help you debug applications or network issues.
As you have seen, you can learn how things work by simply running Wireshark in the background while using them and then inspect the traffic. With this tool under your belt, the sky is the limit.
In future tutorials, we will also rely on our knowledge of Wireshark and use it to further understand various concepts in computer networks.
About the Author
Omer Rosenbaum is Swimm’s Chief Technology Officer. He's the author of the Brief YouTube Channel. He's also a cyber training expert and founder of Checkpoint Security Academy. He's the author of Computer Networks (in Hebrew). You can find him on Twitter.