

You may be used to using the Activity Monitor in MacOS or the Task Manager for Windows to see the current processes running on your system.
But for those running Linux, if that includes a dual boot, virtual box, or even WSL2, you could use a useful Linux command to inspect and look at all the current processes going on in your operating system.
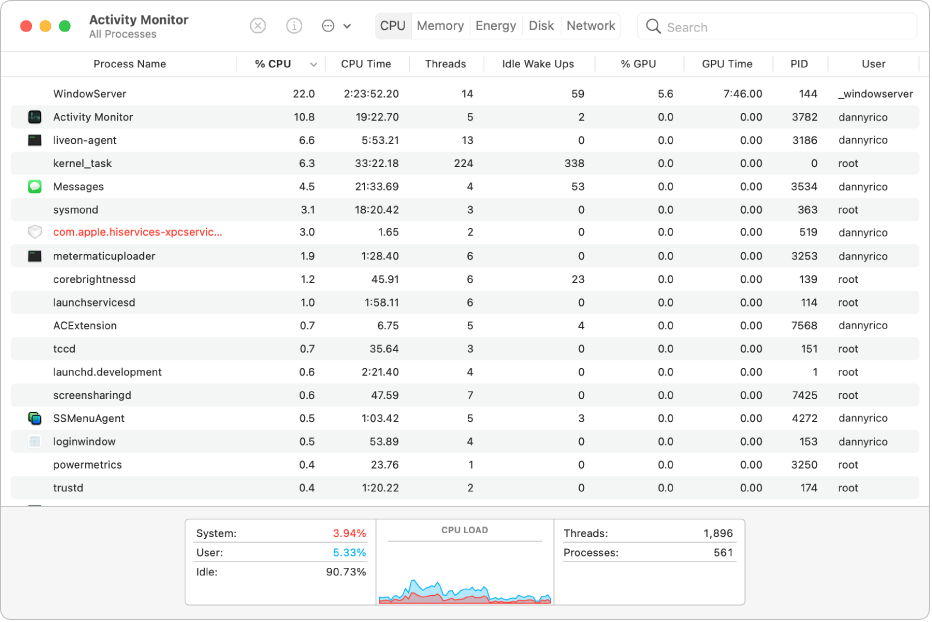 MacOS Activity Monitor
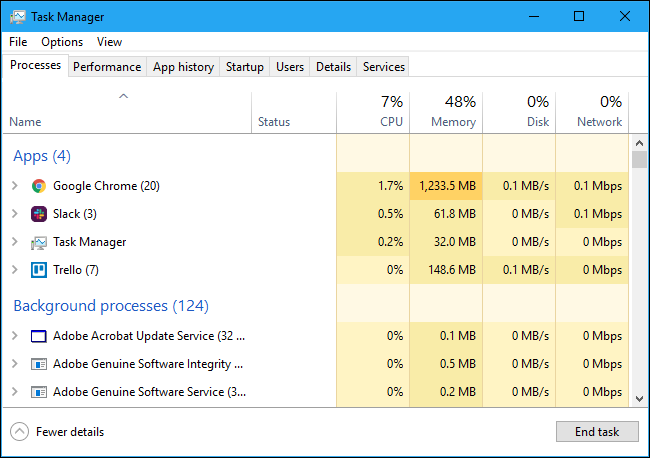 Windows Task Manager
What is the Linux Equivalent?
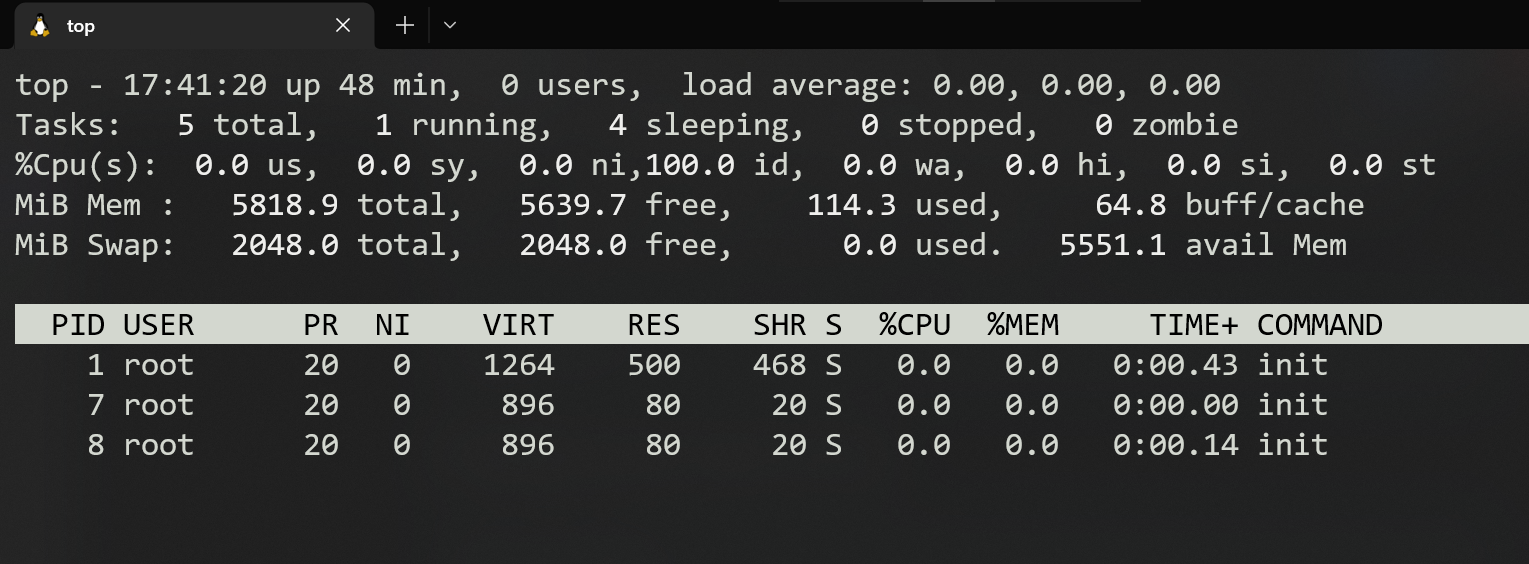
The top (table of processes) command in Linux will display all the system processes. If you were to try this command in your terminal, you would see this:
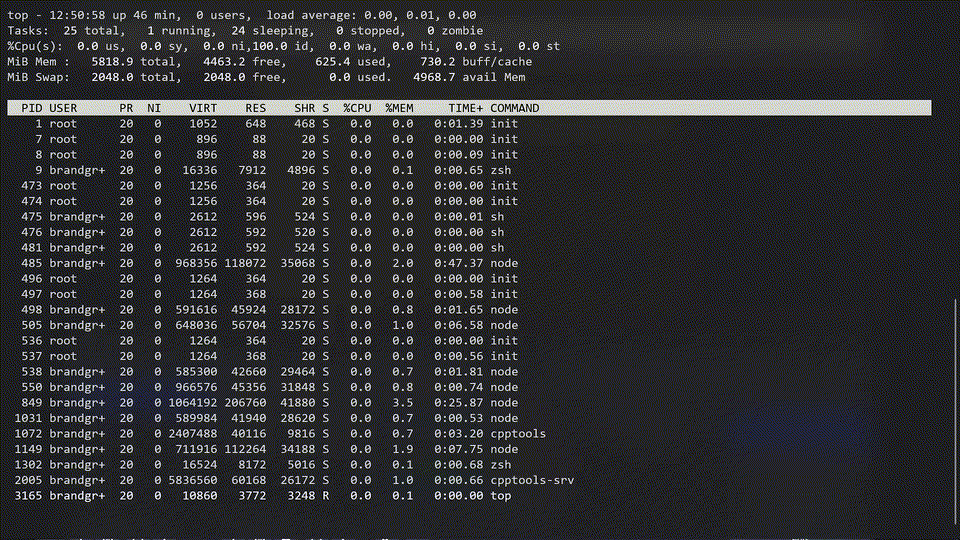
Thats pretty neat – the top program shows a dynamic list of all the running processes going on in your Linux system.
Usually, this command shows a summary of the information on your system that's currently being run/managed by the Linux kernel.
To leave top press q on your keyboard to exit the interactive shell.
What do the columns mean?
- PID: Shows the task's unique process ids.
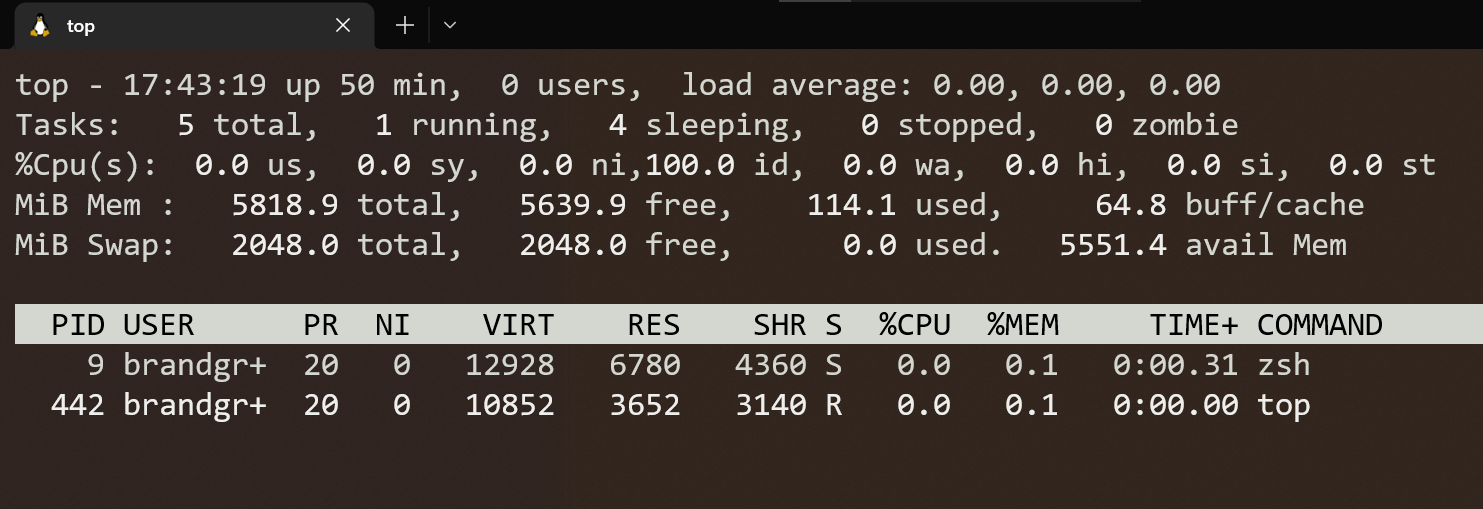
- USER: Shows which user is running what task
For example, you see "root" and "brandgrim". Root is, well, the root of the system running that process, whereas "brandgrim" (me!) is the user running that process.
- PR: This number shows the process priority – the lower the number is, the higher priority. (Makes sense intuitively, right?)
- VIRT: The total virtual memory used by the task
- RES: How much RAM the process is actually using, measured in KB
- SHR: This number represents the Shared Memory size used by a specific task
- %CPU: Represents the CPU usage
- %MEM: Represents the Memory usage
- +TIME: Depicts the total CPU time that the task has used since the task started
- COMMAND: The name of the command that actually started the process
When you are in the interactive shell of top you can press h to bring up the Summary of Less Commands which is a list of all the commands top has to offer.
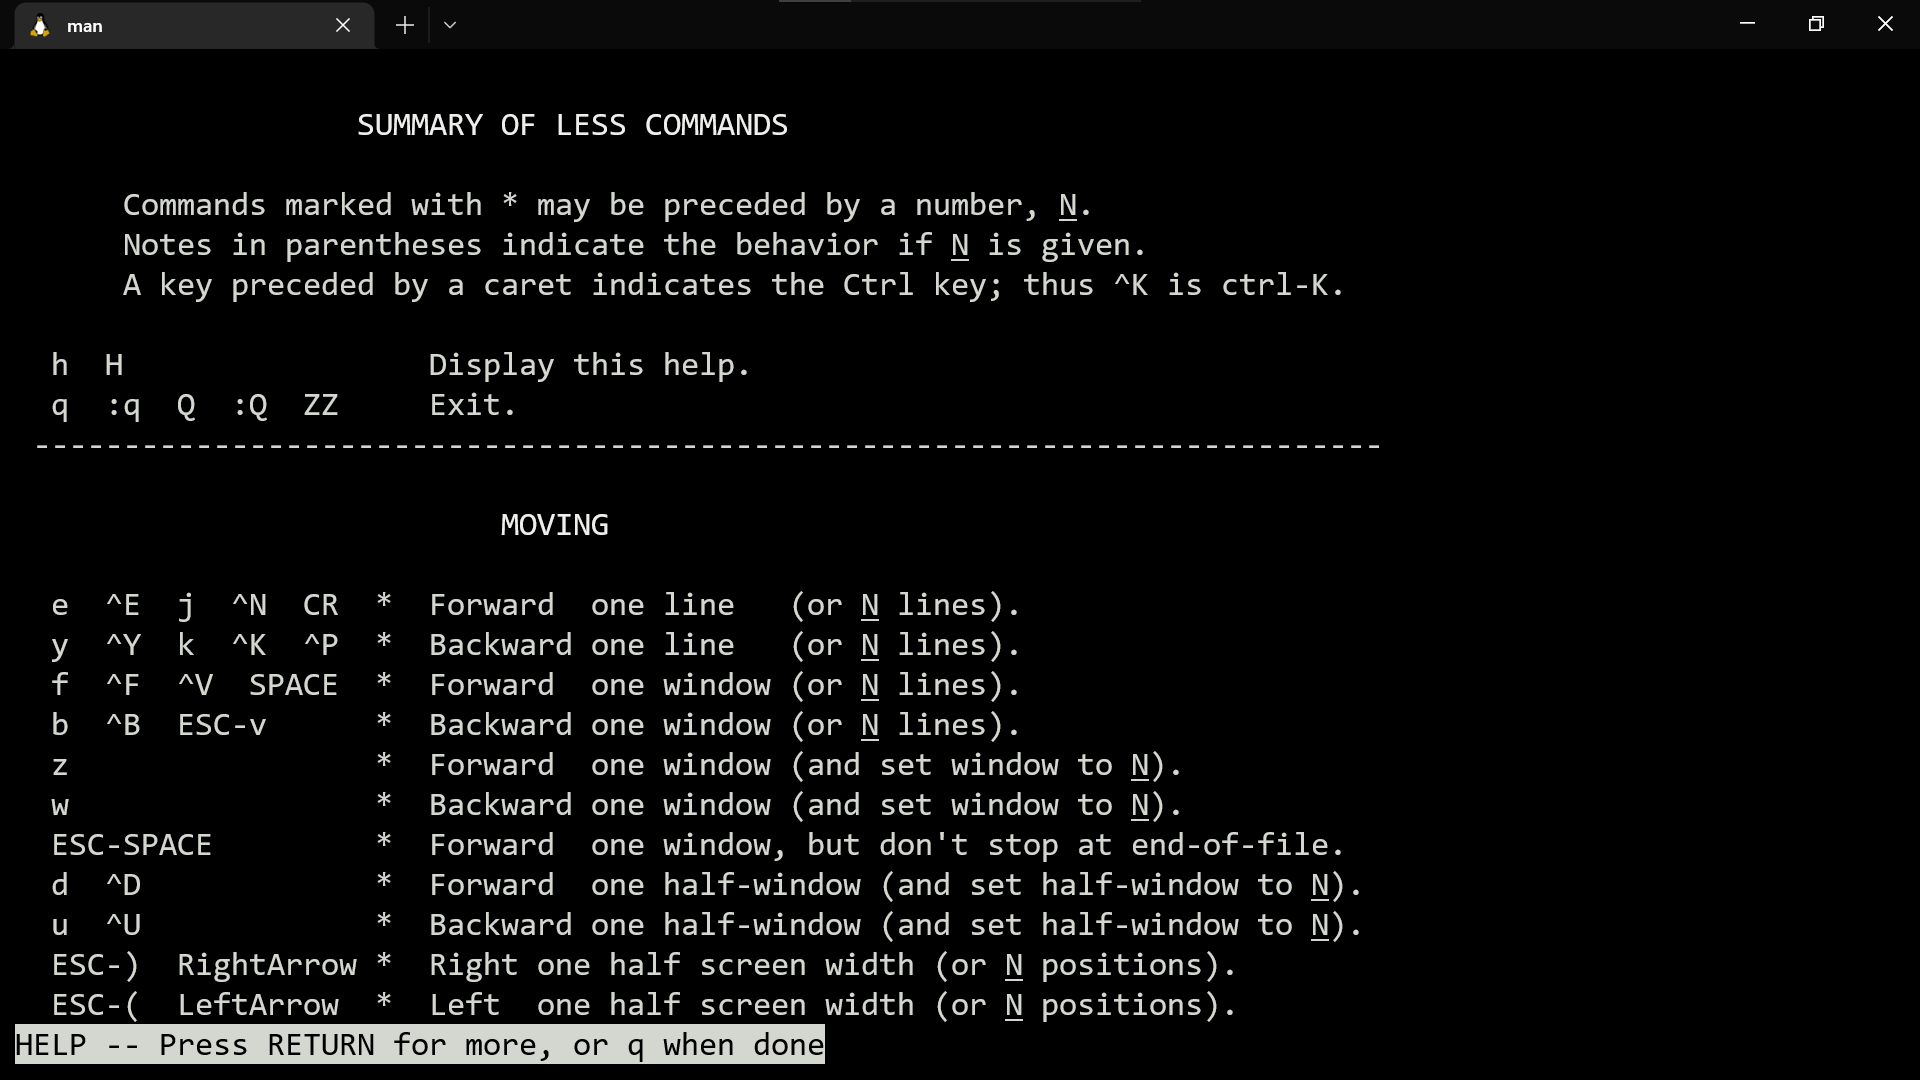 Showing the "Summary of Less Commands" in
 top
Useful Flags and Commands
top has so many unique flags and commands it may seem overwhelming to know which one to use, although there are some flags that are useful right off the bat.
How to Filter by User
The -u flag specifies which processes should be listed depending on what user you specify.
For example, we saw that under the USER column there was "root" and "brandgrim", so if we were to try this:
top -u root
we would see the following:
Which lists out the processes that are being run under the "root" user. If we were to try this command, on the other hand:
top -u brandgrim
We'd get the following (which shows processes being run under the "brandgrim" user):
How to Change the Refresh Interval
By default, the screen refresh interval for top is set to 3.0 seconds. If you would like to increase the interval or decrease it, you can press d while you are in the top interactive shell in order to set a desired time.
 Showing how to change the refresh interval
How to Sort Processes by CPU Utilization
In order to sort all your Linux processes by how much CPU they use, you would need to press the SHIFT + P keys in order to sort them in top. Now you know what was hogging up your CPU – that pesky little while loop that kept running infinitely!
For example, when I filter my processes when I open VSCode, here's what I see:

You can see that the CPU utilization is initially very high, although it starts to decrease as VSCode loads in all my extensions and the Intellisense.
How to Save Top Processes Inside a File
To save all the running top command results into a file, you can use these commands:
top -n 1 -b > top-processes.txt
top Alternatives
There are plenty of top alternatives, such as Htop, Vtop, Gtop, Gotop, and many more – although I won't cover all these in this article.
Htop is currently the most popular top alternative thanks to its interactive menu and the ability to scroll vertically and horizontally. Not to mention that Htop also allows you to view your processes in a tree-like structure, which is easier to visualize.
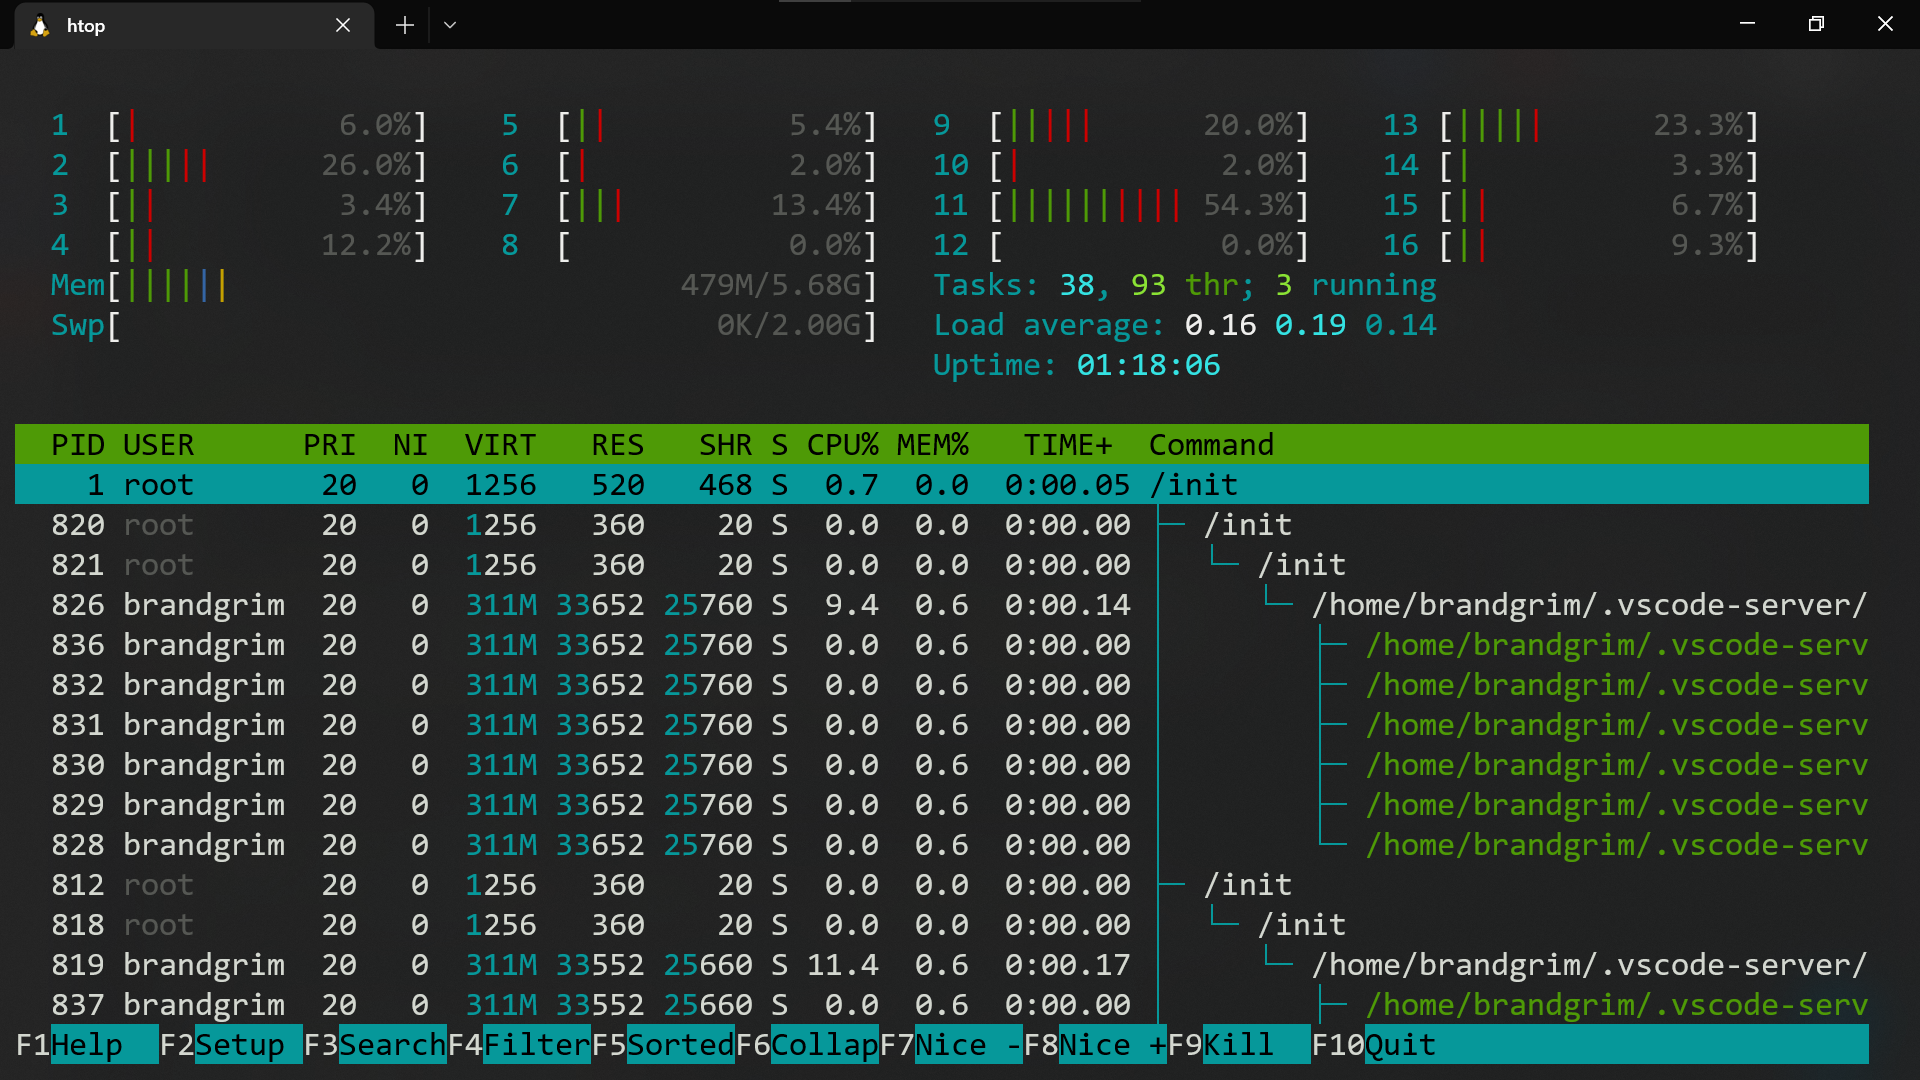 Htop (looks cool!)
Conclusion
top is an interactive shell that allows you to view all your Linux processes in a real-time view. It displays system information along with lists of processes or threads being currently used by the Linux kernel.
top comes with its own useful commands such as the -u flag and d command. There are some more mordern top alternatives like Htop which allows for a more colorful and interactive shell.
Hope this helped you! Thank you for reading :)