By Yannawut Kimnaruk
When you're working on a machine learning project, the most tedious steps are often data cleaning and preprocessing. Especially when you're working in a Jupyter Notebook, running code in many cells can be confusing.
The Scikit-learn library has tools called Pipeline and ColumnTransformer that can really make your life easier. Instead of transforming the dataframe step by step, the pipeline combines all transformation steps. You can get the same result with less code. It's also easier to understand data workflows and modify them for other projects.
This article will show you step by step how to create the machine learning pipeline, starting with an easy one and working up to a more complicated one.
If you are familiar with the Scikit-learn pipeline and ColumnTransformer, you can jump directly to the part you want to learn more about.
Table of Contents
- What is the Scikit-learn Pipeline?
- What is the Scikit-learn ColumnTransformer?
- What's the Difference between the Pipeline and ColumnTransformer?
- How to Create a Pipeline
- How to Find the Best Hyperparameter and Data Preparation Method
- How to Add Custom Transformations
- How to Choose the Best Machine Learning Model
What is the Scikit-learn Pipeline?
Before training a model, you should split your data into a training set and a test set. Each dataset will go through the data cleaning and preprocessing steps before you put it in a machine learning model.
It's not efficient to write repetitive code for the training set and the test set. This is when the scikit-learn pipeline comes into play.
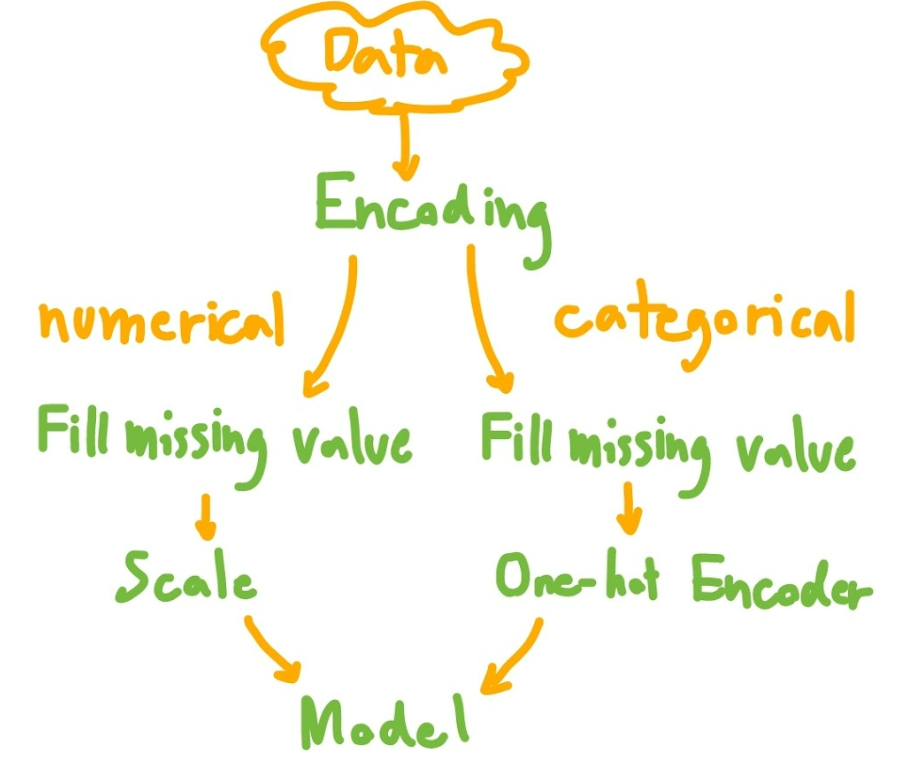
Scikit-learn pipeline is an elegant way to create a machine learning model training workflow. It looks like this:
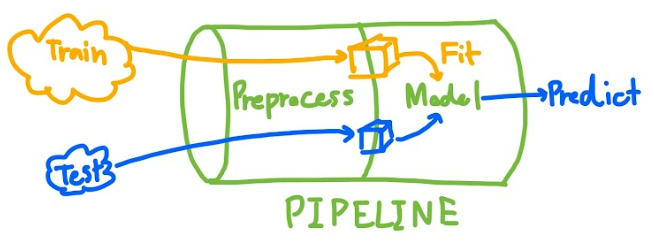 Pipeline illustration
First of all, imagine that you can create only one pipeline in which you can input any data. Those data will be transformed into an appropriate format before model training or prediction.
The Scikit-learn pipeline is a tool that links all steps of data manipulation together to create a pipeline. It will shorten your code and make it easier to read and adjust. (You can even visualize your pipeline to see the steps inside.) It's also easier to perform GridSearchCV without data leakage from the test set.
What is the Scikit-learn ColumnTransformer?
As stated on the scikit-learn website, this is the purpose of ColumnTransformer:
"This estimator allows different columns or column subsets of the input to be transformed separately and the features generated by each transformer will be concatenated to form a single feature space.
This is useful for heterogeneous or columnar data, to combine several feature extraction mechanisms or transformations into a single transformer."
In short, ColumnTransformer will transform each group of dataframe columns separately and combine them later. This is useful in the data preprocessing process.
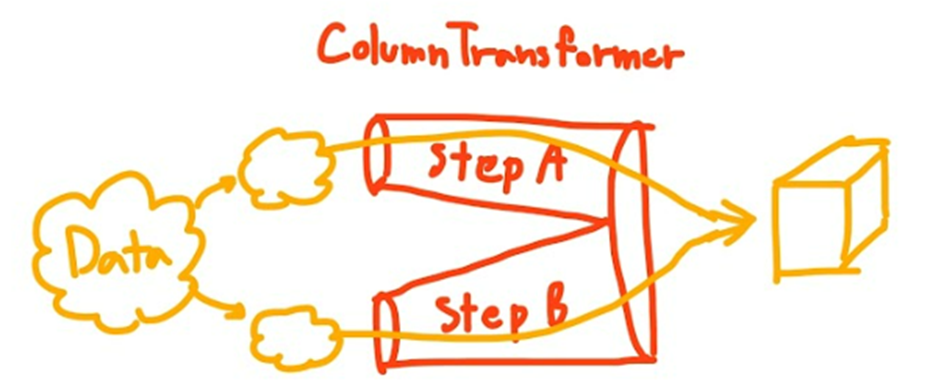 ColumnTransformer Illustration
What's the Difference between the Pipeline and ColumnTransformer?
There is a big difference between Pipeline and ColumnTransformer that you should understand.
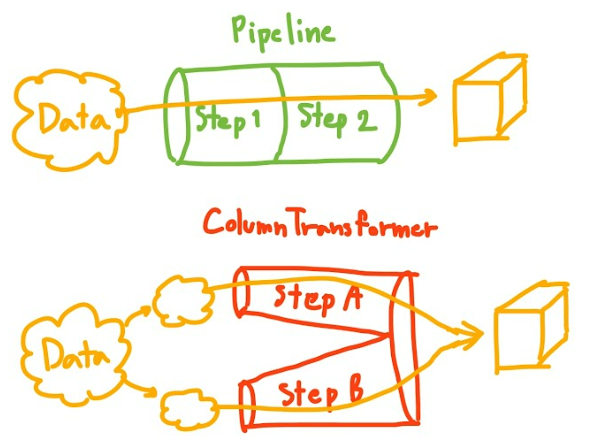 Pipeline VS ColumnTransformer
You use the pipeline for multiple transformations of the same columns.
On the other hand, you use the ColumnTransformer** to transform each column set separately before combining them later.
Alright, with that out of the way, let’s start coding!!
How to Create a Pipeline
Get the Dataset
You can download the data I used in this article from this kaggle dataset. Here's a sample of the dataset:
 Dataset sample
I wrote an article exploring the data from this dataset which you can find here if you're interested.
In short, this dataset contains information about job candidates and their decision about whether they want to change jobs or not. The dataset has both numerical and categorical columns.
Our goal is to predict whether a candidate will change jobs based on their information. This is a classification task.
Data Preprocessing Plan
Note that I skipped categorical feature encoding for the simplicity of this article.
Here are the steps we'll follow:
- Import data and encoding
- Define sets of columns to be transformed in different ways
- Split data to train and test sets
- Create pipelines for numerical and categorical features
- Create ColumnTransformer to apply pipeline for each column set
- Add a model to a final pipeline
- Display the pipeline
- Pass data through the pipeline
- (Optional) Save the pipeline
Step 1: Import and Encode the Data
After downloading the data, you can import it using Pandas like this:
import pandas as pd

df = pd.read_csv("aug_train.csv")
Then, encode the ordinal feature using mapping to transform categorical features into numerical features (since the model takes only numerical input).
# Making Dictionaries of ordinal features

relevent_experience_map = {
    'Has relevent experience':  1,
    'No relevent experience':    0
}

experience_map = {
    '<1'      :    0,
    '1'       :    1,
    '2'       :    2,
    '3'       :    3,
    '4'       :    4,
    '5'       :    5,
    '6'       :    6,
    '7'       :    7,
    '8'       :    8,
    '9'       :    9,
    '10'      :    10,
    '11'      :    11,
    '12'      :    12,
    '13'      :    13,
    '14'      :    14,
    '15'      :    15,
    '16'      :    16,
    '17'      :    17,
    '18'      :    18,
    '19'      :    19,
    '20'      :    20,
    '>20'     :    21
}

last_new_job_map = {
    'never'        :    0,
    '1'            :    1,
    '2'            :    2,
    '3'            :    3,
    '4'            :    4,
    '>4'           :    5
}

# Transform categorical features into numerical features

def encode(df_pre):
    df_pre.loc[:,'relevent_experience'] = df_pre['relevent_experience'].map(relevent_experience_map)
    df_pre.loc[:,'last_new_job'] = df_pre['last_new_job'].map(last_new_job_map)
    df_pre.loc[:,'experience'] = df_pre['experience'].map(experience_map)

    return df_pre

df = encode(df)
Step 2: Define Sets of Columns to be Transformed in Different Ways
Numerical and categorical data should be transformed in different ways. So I define num_col for numerical columns (numbers) and cat_cols for categorical columns.
num_cols = ['city_development_index','relevent_experience', 'experience','last_new_job', 'training_hours']

cat_cols = ['gender', 'enrolled_university', 'education_level', 'major_discipline', 'company_size', 'company_type']
Step 3: Create Pipelines for Numerical and Categorical Features
The syntax of the pipeline is:
Pipeline(steps = [(‘step name’, transform function), …])
For numerical features, I perform the following actions:
- SimpleImputer to fill in the missing values with the mean of that column.
- MinMaxScaler to scale the value to range from 0 to 1 (this will affect regression performance).
For categorical features, I perform the following actions:
- SimpleImputer to fill in the missing values with the most frequency value of that column.
- OneHotEncoder to split to many numerical columns for model training. (handle_unknown=’ignore’ is specified to prevent errors when it finds an unseen category in the test set)
from sklearn.impute import SimpleImputer
from sklearn.preprocessing import OneHotEncoder, MinMaxScaler
from sklearn.pipeline import Pipeline

num_pipeline = Pipeline(steps=[
    ('impute', SimpleImputer(strategy='mean')),
    ('scale',MinMaxScaler())
])
cat_pipeline = Pipeline(steps=[
    ('impute', SimpleImputer(strategy='most_frequent')),
    ('one-hot',OneHotEncoder(handle_unknown='ignore', sparse=False))
])
Step 4: Create ColumnTransformer to Apply the Pipeline for Each Column Set
The syntax of the ColumnTransformer is:
ColumnTransformer(transformers=[(‘step name’, transform function,cols), …])
Pass numerical columns through the numerical pipeline and pass categorical columns through the categorical pipeline created in step 3.
remainder=’drop’ is specified to ignore other columns in a dataframe.
n_job = -1 means that we'll be using all processors to run in parallel.
from sklearn.compose import ColumnTransformer

col_trans = ColumnTransformer(transformers=[
    ('num_pipeline',num_pipeline,num_cols),
    ('cat_pipeline',cat_pipeline,cat_cols)
    ],
    remainder='drop',
    n_jobs=-1)
Step 5: Add a Model to the Final Pipeline
I'm using the logistic regression model in this example.
Create a new pipeline to commingle the ColumnTransformer in step 4 with the logistic regression model. I use a pipeline in this case because the entire dataframe must pass the ColumnTransformer step and modeling step, respectively.
from sklearn.linear_model import LogisticRegression

clf = LogisticRegression(random_state=0)
clf_pipeline = Pipeline(steps=[
    ('col_trans', col_trans),
    ('model', clf)
])
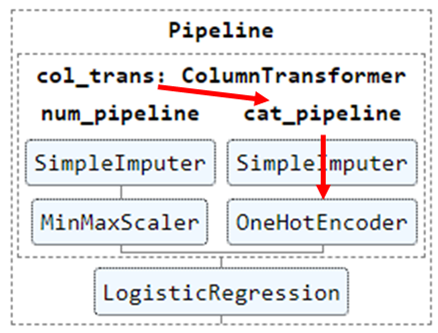
Step 6: Display the Pipeline
The syntax for this is display(pipeline name):
from sklearn import set_config

set_config(display='diagram')
display(clf_pipeline)
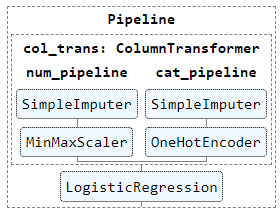 Displayed pipeline
You can click on the displayed image to see the details of each step.
How convenient!
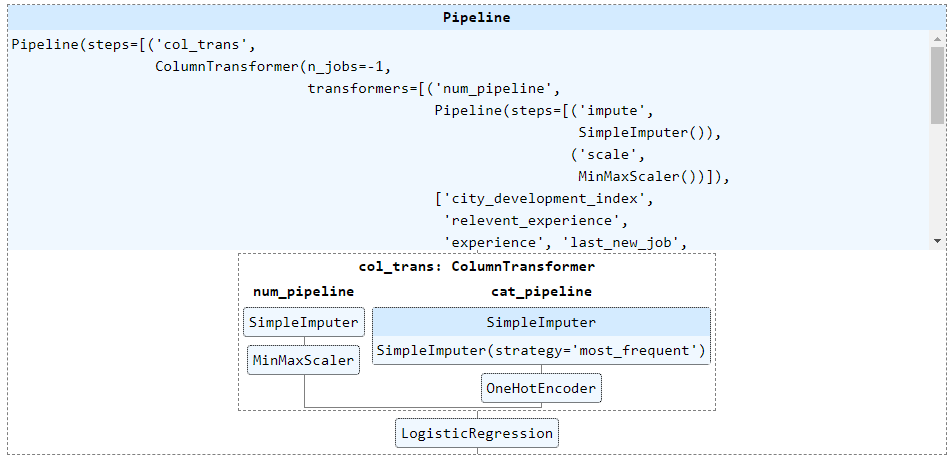 Expanded displayed pipeline
Step 7: Split the Data into Train and Test Sets
Split 20% of the data into a test set like this:
from sklearn.model_selection import train_test_split

X = df[num_cols+cat_cols]
y = df['target']
# train test split
X_train, X_test, y_train, y_test = train_test_split(X, y, test_size=0.2, stratify=y)
I will fit the pipeline for the train set and use that fitted pipeline for the test set to prevent data leakage from the test set to the model.
Step 8: Pass Data through the Pipeline
Here's the syntax for this:
pipeline_name.fit, pipeline_name.predict, pipeline_name.score
pipeline.fit passes data through a pipeline. It also fits the model.
pipeline.predict uses the model trained when pipeline.fits to predict new data.
pipeline.score gets a score of the model in the pipeline (accuracy of logistic regression in this example).
clf_pipeline.fit(X_train, y_train)
# preds = clf_pipeline.predict(X_test)
score = clf_pipeline.score(X_test, y_test)
print(f"Model score: {score}") # model accuracy

(Optional) Step 9: Save the Pipeline
The syntax for this is joblib.dumb.
Use the joblib library to save the pipeline for later use, so you don’t need to create and fit the pipeline again. When you want to use a saved pipeline, just load the file using joblib.load like this:
import joblib

# Save pipeline to file "pipe.joblib"
joblib.dump(clf_pipeline,"pipe.joblib")

# Load pipeline when you want to use
same_pipe = joblib.load("pipe.joblib")
How to Find the Best Hyperparameter and Data Preparation Method
A pipeline does not only make your code tidier, it can also help you optimize hyperparameters and data preparation methods.
Here's what we'll cover in this section:
- How to find the changeable pipeline parameters
- How to find the best hyperparameter sets: Add a pipeline to Grid Search
- How to find the best data preparation method: Skip a step in a pipeline
- How to Find the best hyperparameter sets and the best data preparation method
How to Find the Changeable Pipeline Parameters
First, let’s see the list of parameters that can be adjusted.
clf_pipeline.get_params()
The result can be very long. Take a deep breath and continue reading.
The first part is just about the steps of the pipeline.
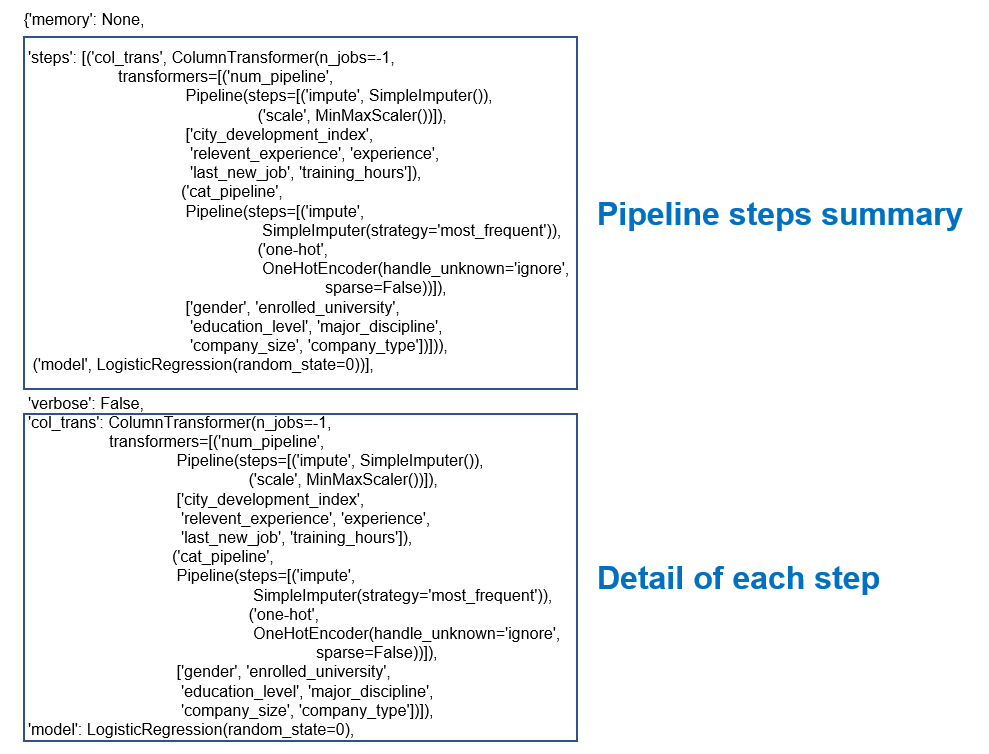
Below the first part you'll find what we are interested in: a list of parameters that we can adjust.
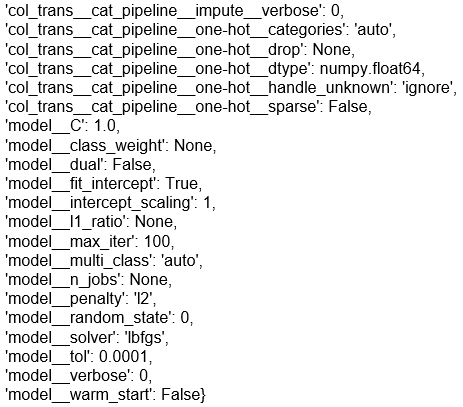
The format is step1step2…_parameter.
For example col_trans_cat_pipelineone-hotsparse means parameter sparse of the one-hot step.
You can change parameters directly using set_param.
clf_pipeline.set_params(model_C = 10)
How to Find the Best Hyperparameter Sets: Add a Pipeline to Grid Search
Grid Search is a method you can use to perform hyperparameter tuning. It helps you find the optimum parameter sets that yield the highest model accuracy.
Set the tuning parameters and their range.
Create a dictionary of tuning parameters (hyperparameters)
{ ‘tuning parameter’ : ‘possible value’, … }
In this example, I want to find the best penalty type and C of a logistic regression model.
grid_params = {'model__penalty' : ['none', 'l2'],
               'model__C' : np.logspace(-4, 4, 20)}
Add the pipeline to Grid Search
GridSearchCV(model, tuning parameter, …)
Our pipeline has a model step as the final step, so we can input the pipeline directly to the GridSearchCV function.
from sklearn.model_selection import GridSearchCV

gs = GridSearchCV(clf_pipeline, grid_params, cv=5, scoring='accuracy')
gs.fit(X_train, y_train)

print("Best Score of train set: "+str(gs.best_score_))
print("Best parameter set: "+str(gs.best_params_))
print("Test Score: "+str(gs.score(X_test,y_test)))
 Result of Grid Search
After setting Grid Search, you can fit Grid Search with the data and see the results. Let's see what the code is doing:
.fit: fits the model and tries all sets of parameters in the tuning parameter dictionary.best_score_: the highest accuracy across all sets of parameters.best_params_: The set of parameters that yield the best score.score(X_test,y_test): The score when trying the best model with the test set.
You can read more about GridSearchCV in the documentation here.
How to Find the Best Data Preparation Method: Skip a Step in a Pipeline
Finding the best data preparation method can be difficult without a pipeline since you have to create so many variables for many data transformation cases.
With the pipeline, we can create data transformation steps in the pipeline and perform a grid search to find the best step. A grid search will select which step to skip and compare the result of each case.
How to adjust the current pipeline a little
I want to know which scaling method will work best for my data between MinMaxScaler and StandardScaler.
I add a step StandardScaler in the num_pipeline. The rest doesn't change.
from sklearn.preprocessing import StandardScaler

num_pipeline2 = Pipeline(steps=[
    ('impute', SimpleImputer(strategy='mean')),
    ('minmax_scale', MinMaxScaler()),
    ('std_scale', StandardScaler()),
])

col_trans2 = ColumnTransformer(transformers=[
    ('num_pipeline',num_pipeline2,num_cols),
    ('cat_pipeline',cat_pipeline,cat_cols)
    ],
    remainder='drop',
    n_jobs=-1)

clf_pipeline2 = Pipeline(steps=[
    ('col_trans', col_trans2),
    ('model', clf)
])
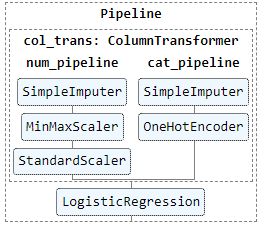 Adjusted pipeline
How to Perform Grid Search
In grid search parameters, specify the steps you want to skip and set their value to passthrough.
Since MinMaxScaler and StandardScaler should not perform at the same time, I will use a list of dictionaries for the grid search parameters.
[{case 1},{case 2}]
If using a list of dictionaries, grid search will perform a combination of every parameter in case 1 until complete. Then, it will perform a combination of every parameter in case 2. So there is no case where MinMaxScaler and StandardScaler are used together.
grid_step_params = [{'col_trans__num_pipeline__minmax_scale': ['passthrough']},
                    {'col_trans__num_pipeline__std_scale': ['passthrough']}]
Perform Grid Search and print the results (like a normal grid search).
gs2 = GridSearchCV(clf_pipeline2, grid_step_params, scoring='accuracy')
gs2.fit(X_train, y_train)

print("Best Score of train set: "+str(gs2.best_score_))
print("Best parameter set: "+str(gs2.best_params_))
print("Test Score: "+str(gs2.score(X_test,y_test)))

The best case is minmax_scale : ‘passthrough’, so StandardScaler is the best scaling method for this data.
How to Find the Best Hyperparameter Sets and the Best Data Preparation Method
You can find the best hyperparameter sets and the best data preparation method by adding tuning parameters to the dictionary of each case of the data preparation method.
grid_params = {'model__penalty' : ['none', 'l2'],
               'model__C' : np.logspace(-4, 4, 20)}

grid_step_params = [{**{'col_trans__num_pipeline__minmax_scale': ['passthrough']}, **grid_params},
                    {**{'col_trans__num_pipeline__std_scale': ['passthrough']}, **grid_params}]
grid_params will be added to both case 1 (skip MinMaxScaler) and case 2 (skip StandardScalerand).
# You can merge dictionary using the syntax below.

merge_dict = {**dict_1,**dict_2}
Perform Grid Search and print the results (like a normal grid search).
gs3 = GridSearchCV(clf_pipeline2, grid_step_params2, scoring='accuracy')
gs3.fit(X_train, y_train)

print("Best Score of train set: "+str(gs3.best_score_))
print("Best parameter set: "+str(gs3.best_params_))
print("Test Score: "+str(gs3.score(X_test,y_test)))

You can find the best parameter set using .bestparams. As minmax_scale : ‘passthrough’, so StandardScaler is the best scaling method for this data.
You can show all grid search cases using .cvresults:
pd.DataFrame(gs3.cv_results_)
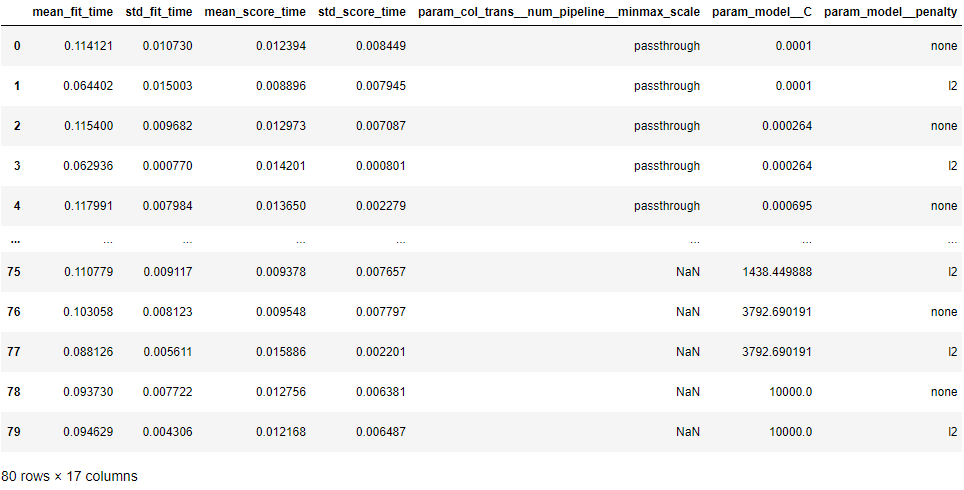 GridSearch result
There are 80 cases for this example. There's running time and accuracy of each case for you to consider, since sometimes we may select the fastest model with acceptable accuracy instead of the highest accuracy one.
How to Add Custom Transformations and Find the Best Machine Learning Model
Searching for the best machine learning model can be a time-consuming task. The pipeline can make this task much more convenient so that you can shorten the model training and evaluation loop.
Here's what we'll cover in this part:
- Add a custom transformation
- Find the best machine learning model
How to Add a Custom Transformation
Apart from standard data transformation functions such as MinMaxScaler from sklearn, you can also create your own transformation for your data.
In this example, I will create a class method to encode ordinal features using mapping to transform categorical features into numerical ones. In simple words, we'll change data from text to numbers.
First we'll do the required data processing before regression model training.
from sklearn.base import TransformerMixin

class Encode(TransformerMixin):

    def __init__(self):
        # Making Dictionaries of ordinal features
        self.rel_exp_map = {
            'Has relevent experience': 1,
            'No relevent experience': 0}

    def fit(self, df, y = None):
        return self

    def transform(self, df, y = None):
        df_pre = df.copy()
        df_pre.loc[:,'rel_exp'] = df_pre['rel_exp']\
                               .map(self.rel_exp_map)
        return df_pre
Here's an explanation of what's going on in this code:
- Create a class named Encode which inherits the base class called TransformerMixin from sklearn.
- Inside the class, there are 3 necessary methods:
__init__,fit, andtransform __init__will be called when a pipeline is created. It is where we define variables inside the class. I created a variable ‘rel_exp_map’ which is a dictionary that maps categories to numbers.fitwill be called when fitting the pipeline. I left it blank for this case.transformwill be called when a pipeline transform is used. This method requires a dataframe (df) as an input while y is set to be None by default (It is forced to have y argument but I will not use it anyway).- In transform, the dataframe column ‘rel_exp’ will be mapped with the rel_exp_map.
Note that the \ is only to continue the code to a new line.
Next, add this Encode class as a pipeline step.
pipeline = Pipeline(steps=[
    ('Encode', Encode()),
    ('col_trans', col_trans),
    ('model', LogisticRegression())
])
Then you can fit, transform, or grid search the pipeline like a normal pipeline.
How to Find the Best Machine Learning Model
The first solution that came to my mind was adding many model steps in a pipeline and skipping a step by changing the step value to ‘passthrough’ in the grid search. This is like what we did when finding the best data preparation method.
temp_pipeline = Pipeline(steps=[
    ('model1', LogisticRegression()),
    ('model2',SVC(gamma='auto'))
])
But I saw an error like this:
 Error when there are 2 classifiers in 1 pipeline
Ah ha – you can’t have two classification models in a pipeline!
The solution to this problem is to create a custom transformation that receives a model as an input and performs grid search to find the best model.
Here are the steps we'll follow:
- Create a class that receives a model as an input
- Add the class in step 1 to a pipeline
- Perform grid search
- Print grid search results as a table
Step 1: Create a class that receives a model as an input
from sklearn.base import BaseEstimator
from sklearn.linear_model import LogisticRegression
from sklearn.svm import SVC

class ClfSwitcher(BaseEstimator):

def __init__(self, estimator = LogisticRegression()):
        self.estimator = estimator

def fit(self, X, y=None, **kwargs):
        self.estimator.fit(X, y)
        return self

def predict(self, X, y=None):
        return self.estimator.predict(X)

def predict_proba(self, X):
        return self.estimator.predict_proba(X)

def score(self, X, y):
        return self.estimator.score(X, y)
Code explanation:
- Create a class named
ClfSwitcherwhich inherits the base class called BaseEstimator from sklearn. - Inside the class, there are five necessary methods like
classification model: __init__,fit,predict,predict_probaandscore __init__receives an estimator (model) as an input. I stated LogisticRegression() as a default model.fitis for model fitting. There's no return value.- The other methods are to simulate the model. It will return the result as if it's the model itself.
Step 2: Add the class in step 1 to a pipeline
clf_pipeline = Pipeline(steps=[
    ('Encode', Encode()),
    ('col_trans', col_trans),
    ('model', ClfSwitcher())
])
Step 3: Perform Grid search
There are 2 cases using different classification models in grid search parameters, including logistic regression and support vector machine.
from sklearn.model_selection import GridSearchCV

grid_params = [
    {'model__estimator': [LogisticRegression()]},
    {'model__estimator': [SVC(gamma='auto')]}
]

gs = GridSearchCV(clf_pipeline, grid_params, scoring='accuracy')
gs.fit(X_train, y_train)

print("Best Score of train set: "+str(gs.best_score_))
print("Best parameter set: "+str(gs.best_params_))
print("Test Score: "+str(gs.score(X_test,y_test)))
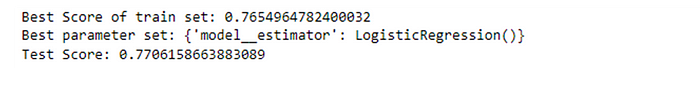 Grid Search Result
The result shows that logistic regression yields the best result.
Step 4: Print grid search results as a table
pd.DataFrame(gs.cv_results_)
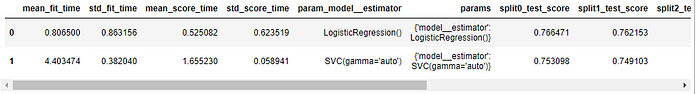 Grid Search Result Table
Logistic regression has a little higher accuracy than SVC but is much faster (less fit time).
Remember that you can apply different data preparation methods for each model as well.
Conclusion
You can implement the Scikit-learn pipeline and ColumnTransformer from the data cleaning to the data modeling steps to make your code neater.
You can also find the best hyperparameter, data preparation method, and machine learning model with grid search and the passthrough keyword.
You can find my code in this GitHub