By Pier Paolo Ippolito
Computer Vision is one of the most important applications of Machine Learning. Some common commercial applications of Computer Vision are:
- Predictive maintenance for industrial infrastructure, oil and gas pipelines, and commercial real estate
- Quality assurance automation
- Landscape inventory and parcel management based on satellite imagery and drone footage
And some of the most common techniques used in order to accomplish these kind of tasks are:
- Image Classification
- Object Detection
- Instance Segmentation
During the past decade, many frameworks such as TensorFlow, Keras and PyTorch have been developed in order to make it easier to develop Computer Vision-based models.
But it is still relatively difficult to work with image data due to the necessary image pre-processing, labelling, and annotation visualization.
As part of this article, I am going to introduce you to Remo, a free Python library designed to help developers work on Computer Vision tasks. Remo can help you:
- Organize and visualize images and annotations
- Efficiently annotate
- Work and collaborate as a team on the data
Remo can be used either in a Jupyter Notebook or in the Google Colab environment. In this article, all the code is going to be based on the Google Colab set-up and the full notebook is freely available at this link.
How Remo Improves Image Management
There are a number of legacy open annotation tools for images available out there. LabelImg is one of the most popular ones.
Compared to these tools, Remo offers smart tools to annotate more efficiently (for example, shortcuts and xclick draw) and functionalities that help you collaborate and organize your work. You can mark images as Done or To Do, sort them and search them, and so on – which is very useful when you're working with thousands of images.
But datasets management is where Remo is very innovative. At present, images in Computer Vision projects are usually stored as flat files in a local hard disk or some Cloud storage, and annotations are saved as raw XML/JSON/csv files.
To visualize them, you would usually either open each file individually and try to imagine where annotations are, or plot them one by one in Python.
Instead, Remo gives you full control and visibility of all the data.
Demonstration of How Remo Works
First of all, we need to install all the necessary dependencies. This can be easily done in Google Colab by running the following two lines of code:
!pip install remo
!python -m remo_app init --colab
Once we've installed Remo, we can then create a dataset using some example images freely available on Amazon Web Services.
import remo
import pandas

link = ['https://remo-scripts.s3-eu-west-1.amazonaws.com/open_images_sample_dataset.zip']

df = remo.create_dataset(name = 'Example Images Dataset',
                    urls = link,
                    annotation_task = "Object Detection")

# Output
# Acquiring data - completed
# Processing annotation files: 1 of 1 files
# Processing data - completed
# Data upload completed
By running the Remo list_datasets() command we can then easily check what datasets we currently have available.
remo.list_datasets()

# Output
# [Dataset  1 - 'Example Images Dataset' - 10 images]
We are now ready to use Remo's graphical interface in order to inspect our dataset and see the different options available.
In Figure 1, you'll see a simple example of how easy it can be to visualize and annotate our data using Remo.
df.view()
 Figure 1: Remo's GUI Data Pre-processing
Another important advantage of using Remo is that it lets you quickly get key dataset statistics either through Python code or the user interface.
This can be particularly useful when you're trying to understand how annotations are distributed between different images and if the overall classes distribution is balanced or not.
df.get_annotation_statistics()

# Output
# [{'AnnotationSet ID': 1,
#  'AnnotationSet name': 'Object detection',
#  'creation_date': None,
#  'last_modified_date': '2020-11-28T22:04:48.263767Z',
#  'n_classes': 18,
#  'n_images': 10,
#  'n_objects': 98,
#  'top_3_classes': [{'count': 27, 'name': 'Fruit'},
#   {'count': 12, 'name': 'Sports equipment'},
#   {'count': 10, 'name': 'Human arm'}]}]
You can see similar results by using Remo's Graphical Interface (Figure 2).
df.view_annotation_stats()
 Figure 2: Remo's Statistics Functionalities
Finally, if you used the Remo interface to add annotations to the different images of your dataset, these can be automatically exported in a CSV format. This lets you use them later and takes advantage of Remo's export_annotations_to_file() function.
df.export_annotations_to_file('images_annotations.zip', annotation_format='csv', export_tags = False)
Conclusion
To summarize, some of the key functionalities provided by Remo are:
- Dataset management capabilities
- Multiple file formats supported along with computer vision tasks
- User friendly interface and enhanced annotation tools
- Easy collaboration on a project
- Support for Virtual Machine use
If you are interested in either finding out more about Remo (like how to integrate Remo with other frameworks such as PyTorch) or how to set up this workflow in a Jupyter Notebook environment, the official Remo documentation is a great place to start.
I hope you enjoyed this article, thank you for reading!
Contact me
If you want to keep updated with my latest articles and projects follow me on Medium and subscribe to my mailing list. These are some of my contacts details:
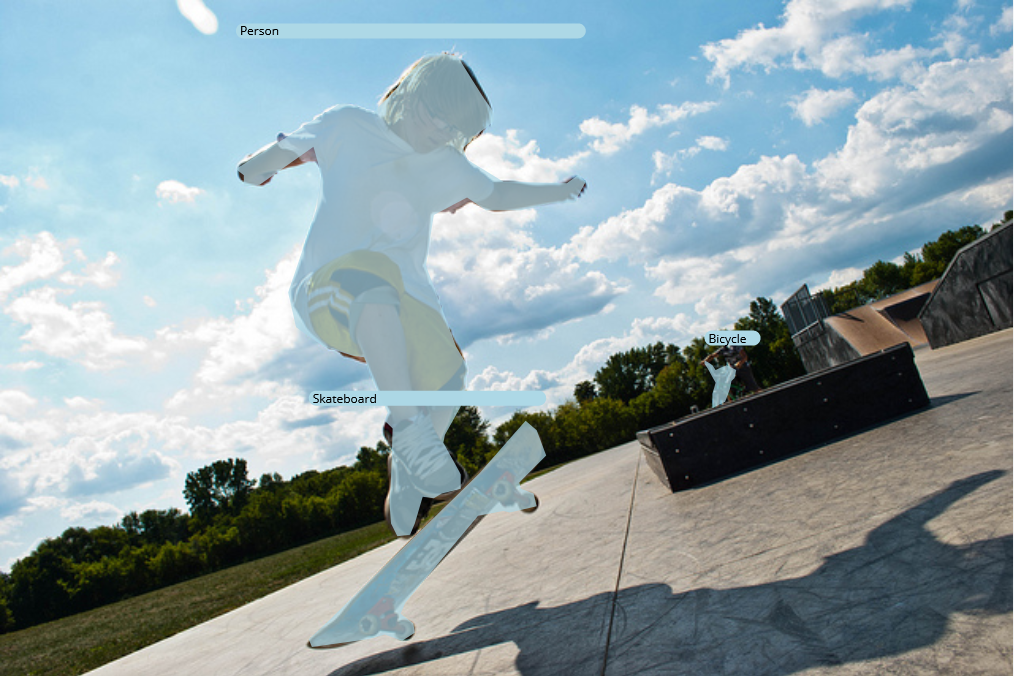
Cover photo from Remo documentation.