
By dor sever
One of the coolest things I have learned in the last year is how to constantly deliver value into production without causing too much chaos.
In this post, I’ll explain the metrics-driven development approach and how it helped me to achieve that. By the end of the post, you’ll be able to answer the following questions:
- What are metrics and why should I use them
- What are the different types of metrics
- What tools could I use to store and display metrics
- What is a real-world example of metrics-driven development
What are metrics and why should I use them?
Metrics give you the ability to collect information on an actively running system without changing its code.
It allows you to gain valuable data on the behavior of your application while it runs so you can make data-driven decisions based on real customer feedback and usage in production.
What are the types of metrics available to me?
These are the most common metrics used today:
- Counter — Represents a monotonically increasing value.
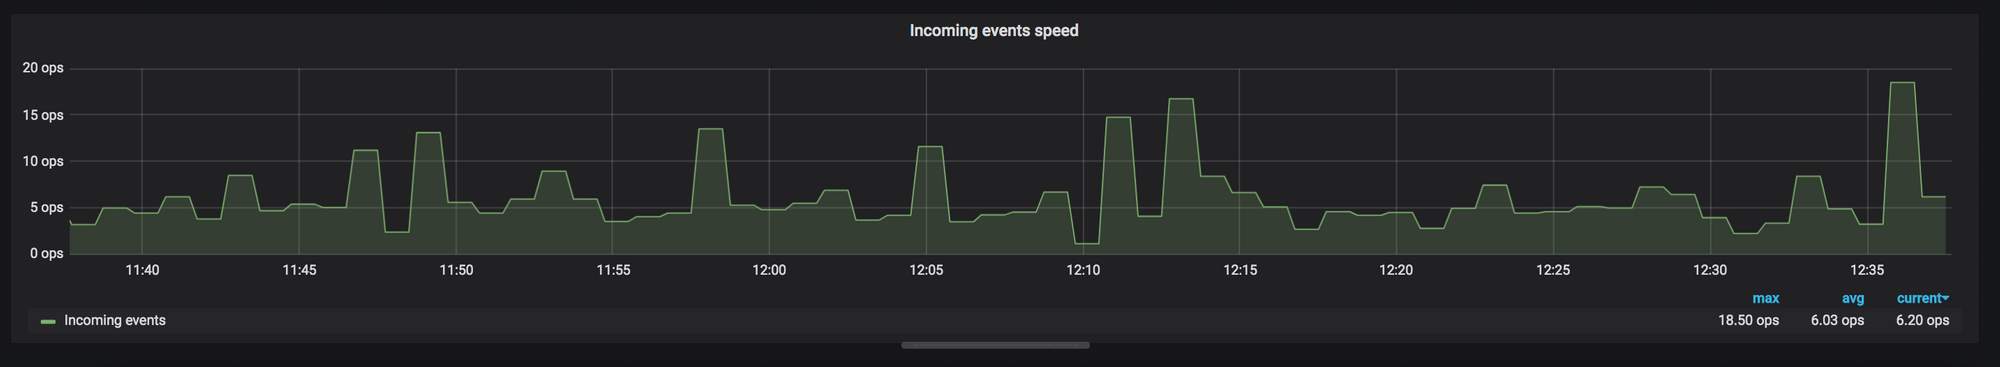 Counters are really useful for measuring rates!
In this example, a counter metric is used to calculate the rate of events over time, by counting events per second
- Gauge — Represents a single value that can go up or down.
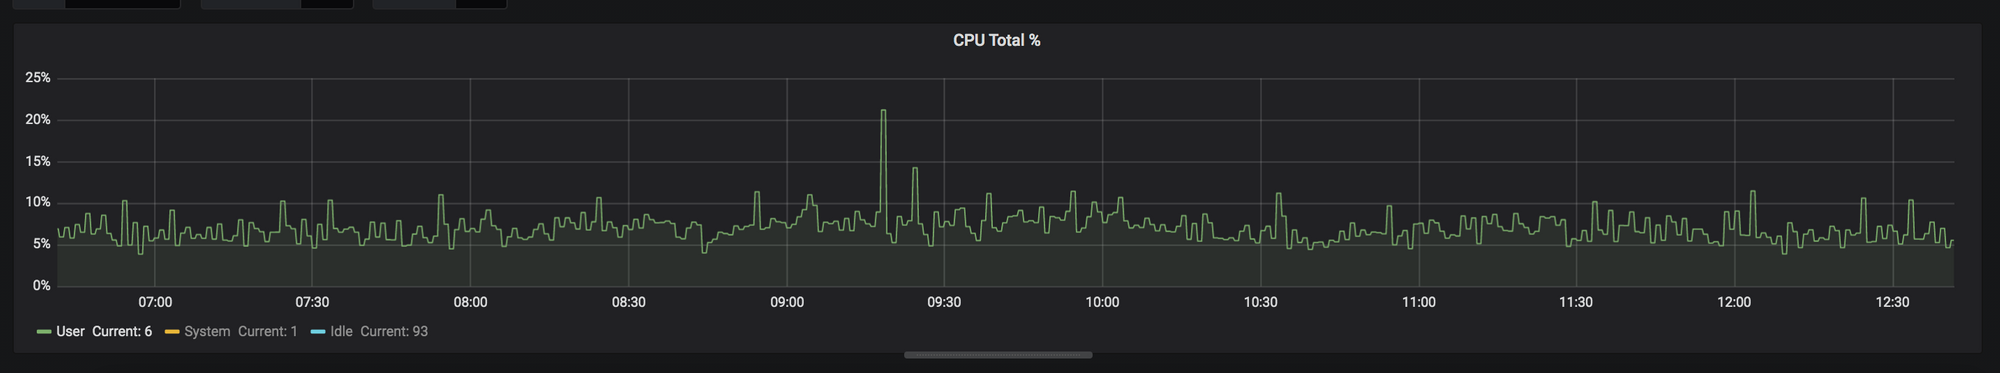 Gauges are really useful for measuring CPU usage!
In this example, a gauge metric is used to monitor the user CPU in percentages
- Histogram — A counting of observations (like request durations or sizes) in configurable buckets.
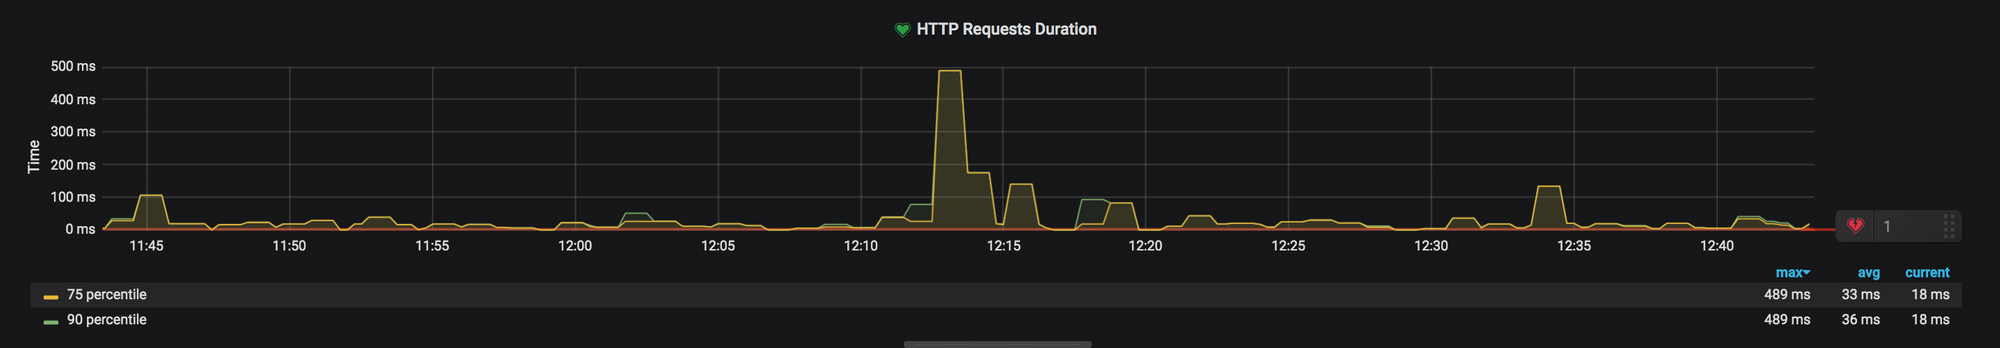 Histograms are really useful for measuring request duration!
In this example, a histogram metric is used to calculate the 75th and 90th percentiles of an HTTP request duration.
The bits and bytes of the types: counter, histogram, and gauge can be quite confusing. Try reading about it further here.
What tools can I use to store and display metrics?
Most monitoring systems consist of a few parts:
- Time-series database — A database software that optimizes storing and serving time-series data. Two examples of this kind of database are Whisper and Prometheus.
- Querying engine (with a querying language) — Two examples of common query engines are: Graphite and PromQL
- Alerting system — The mechanism that allows you to configure alerts based on graphs created by the querying language. The system can send these alerts to Mail, Slack, PagerDuty. Two examples of common alerting systems are: Grafana and Prometheus.
- UI — Allows you to view the graphs generated by the incoming data and configure queries and alerts. Two examples of common UI systems are: Graphite and Grafana
The setup we are using today in BigPanda Engineering is
- Telegraf — used as a StatsD server.
- Prometheus — used as our scrapping engine, Time-series database and querying engine.
- Grafana — used for Alerting, and UI
And the constraints we had in mind while choosing this stack were:
- We want scalable and elastic metrics scraping
- We want a performant query engine
- We want the ability to query our metrics using custom tags(such as service names, hosts, etc.)
A real-world example of Metrics-driven development of a Sentiment Analysis service
Let’s develop a new pipeline service that calculates sentiments based on textual inputs and does it in a Metrics Driven Development way!
Let’s say I need to develop this pipeline service:
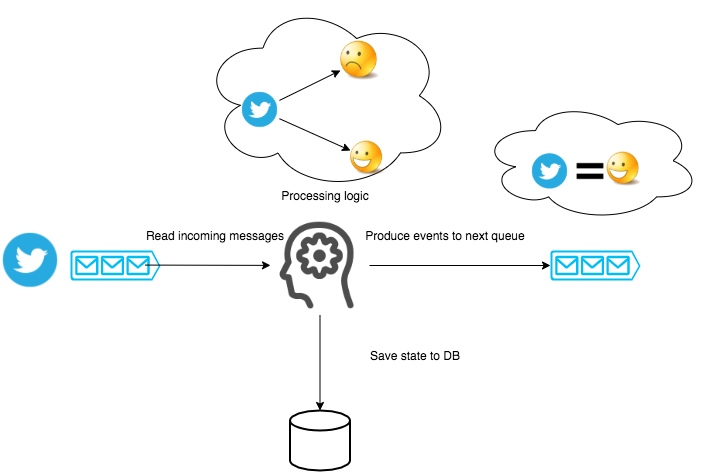 Sentiment analysis pipeline architecture
And this is my usual development process:
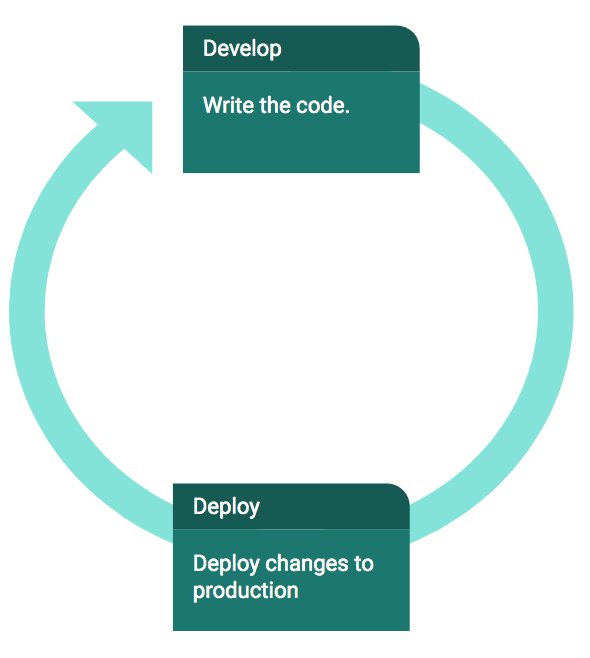 Usual development process - Test, code and deploy. Oh my!
So I write the following implementation:
let senService: SentimentAnalysisService = new SentimentAnalysisService();
while (true) {
    let tweetInformation = kafkaConsumer.consume()
    let deserializedTweet: { msg: string } = deSerialize(tweetInformation)
    let sentimentResult = senService.calculateSentiment(deserializedTweet.msg)
    let serializedSentimentResult = serialize(sentimentResult)
    sentimentStore.store(sentimentResult);
    kafkaProducer.produce(serializedSentimentResult, 'sentiment_topic', 0);
}
The full gist can be found here.
And this method works perfectly fine**.
But what happens when it doesn’t?

The reality is that while working (in an agile development process) we make mistakes. That’s a fact of life.
I believe that the real challenge with making mistakes is not to avoid them, but rather to optimize how fast we detect and repair them. So, we need to gain the ability to quickly discover our mistakes.
It's time for the MDD-way.
The Metrics Driven Development (MDD) way
 Behold! The Three Commandments of Production!
The MDD approach is heavily inspired by the Three Commandments of Production (which I had learned about the hard way).
The Three Commandments of Production are:
- There are mistakes and bugs in the code you write and deploy.
- The data flowing in production is unpredictable and unique!
- Perfect your code from real customer feedback and usage in production.
And since we now know the Commandments, it's time to go over the 4 step plan of the Metrics-Driven development process.
The 4-step plan for a successful MDD
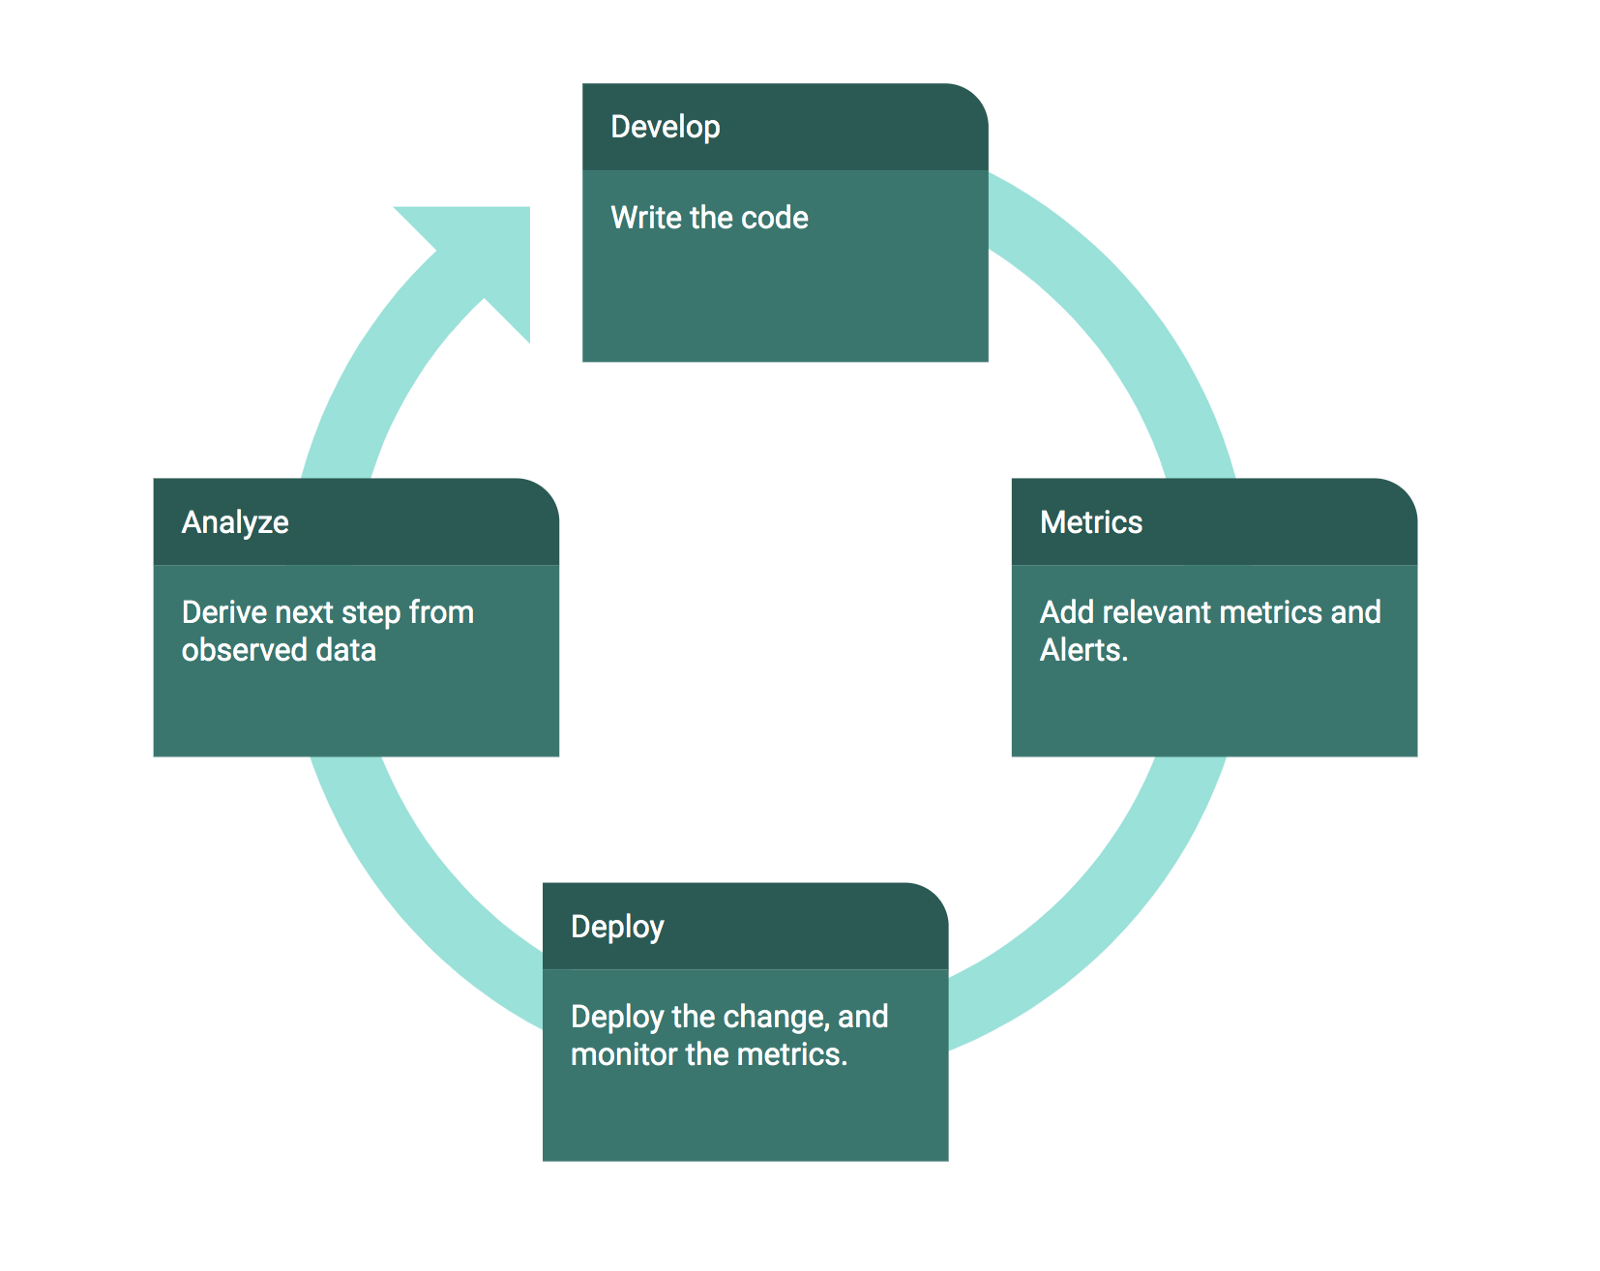 Metrics-driven development ?Oh wow!
Develop code
I write the code, and whenever possible, wrap it with a feature flag that allows me to gradually open it for users.
Metrics
This consists of two parts:
Add metrics on relevant parts
In this part, I ask myself what are the success or failure metrics I can define to make sure my feature works? In this case, does my new pipeline application perform its logic correctly?
Add alerts on top of them so that I’ll be alerted when a bug occurs
In this part, I ask myself What metric could alert me if I forgot something or did not implement it correctly?
Deployment
I deploy the code and immediately monitor it to verify that it’s behaving as I have anticipated.
Iterate this process to perfection
And that's it! Now that we have learned the process, let's tackle an important task inside it.
Metrics to Report — what should we monitor?
One of the toughest questions for me, when I’m doing MDD, is: “what should I monitor”?
 That’s a lovely gif. but un-realistic in most cases.
In order to answer the question, lets try to zoom out and look at the big picture.
All the possible information available to monitor can be divided into two parts:
- Applicative information — Information that has an applicative context and meaning. An example of this will be — “How many tweets did we classify as positive in the last hour”?
- Operational information — Information that is related to the infrastructure that surrounds our application — Cloud data, CPU and disk utilization, network usage, etc.
Now, since we cannot monitor everything, we need to choose what applicative and operational information we want to monitor.
- The operational part really depends on your ops stack and has built-in solutions for (almost) all your monitoring needs.
- The applicative part is more unique to your needs, and I'll try to explain how I think about it later in this post.
After we do that, we can ask ourselves the question: what alerts do we want to set up on top of the metrics we just defined?
The diagram (of information, metrics, alerts) can be drawn like this:
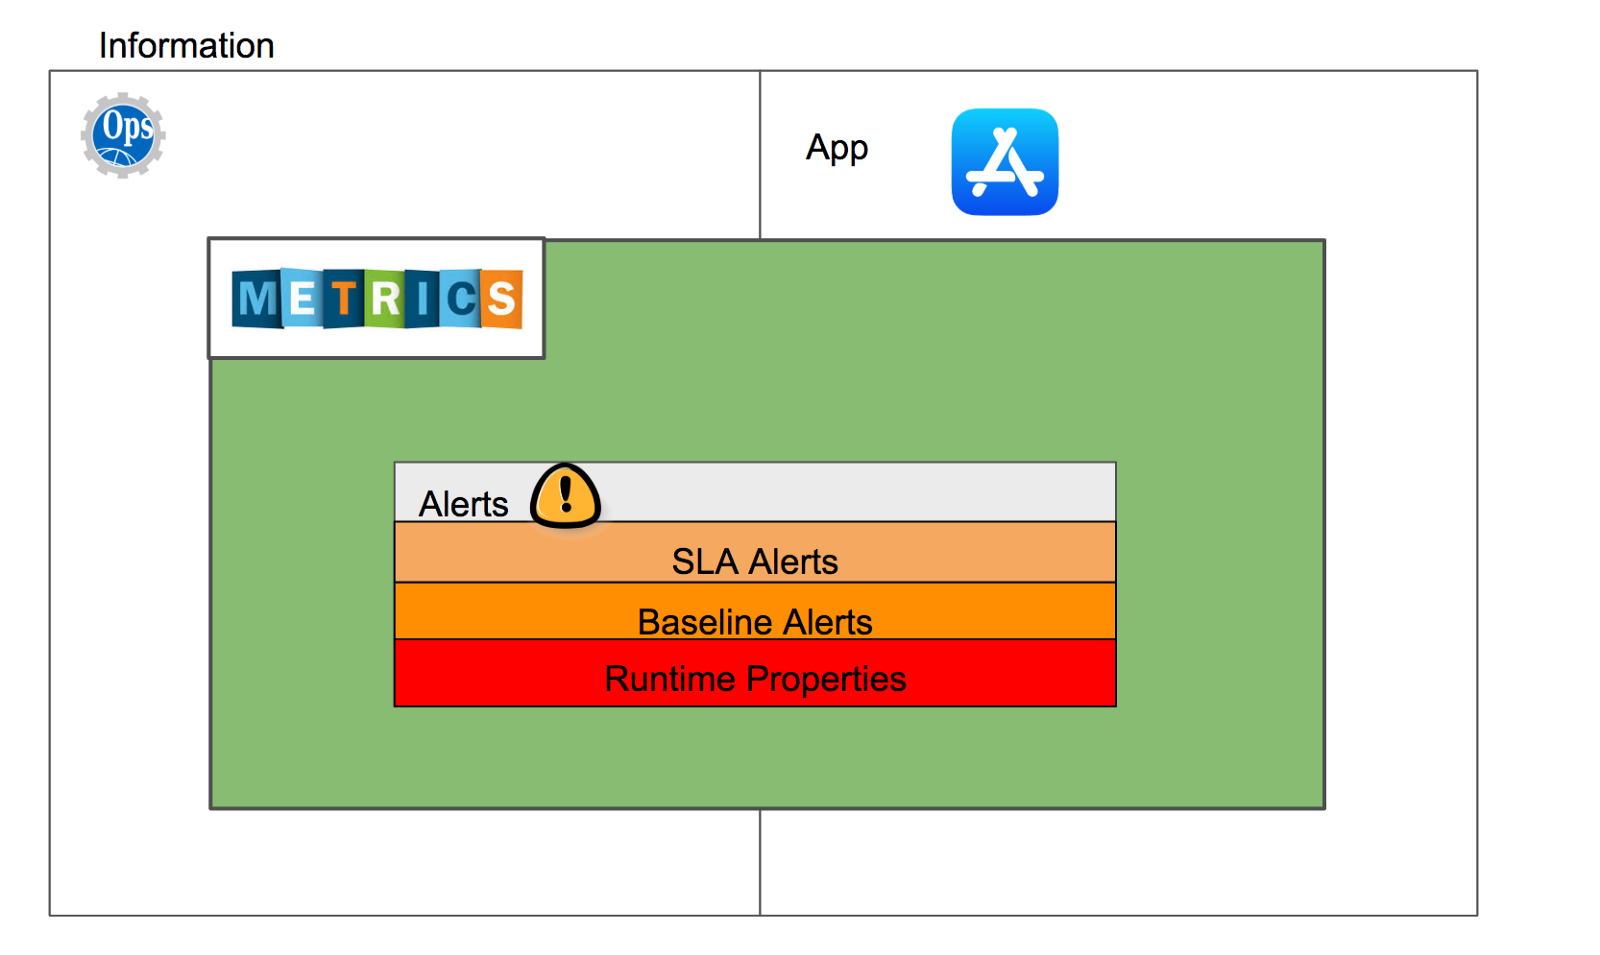 The world of information, metrics, and alerts.
Applicative metrics
I usually add applicative metrics out of two needs:
To answer questions
A question is something like, “When my service misbehaves, what information would be helpful to know about?”
Some answers to that question can be — latencies of all IO calls, processing rate, throughput, etc…
Most of these questions will be helpful while you are searching for the answer. But once you found it, chances are you will not look at it again (since you already know the answer).
These questions are usually driven by RND and are (usually) used to gather information internally.
To add Alerts
This may sound backward, but I usually add applicative metrics in order to define alerts on top of them. Meaning, we define the list of alerts and then deduce from them what are the applicative metrics to report.
These alerts are derived from the SLA of the product and are usually treated with mission-critical importance.
Common types of alerts
Alerts can be broken down into three parts:
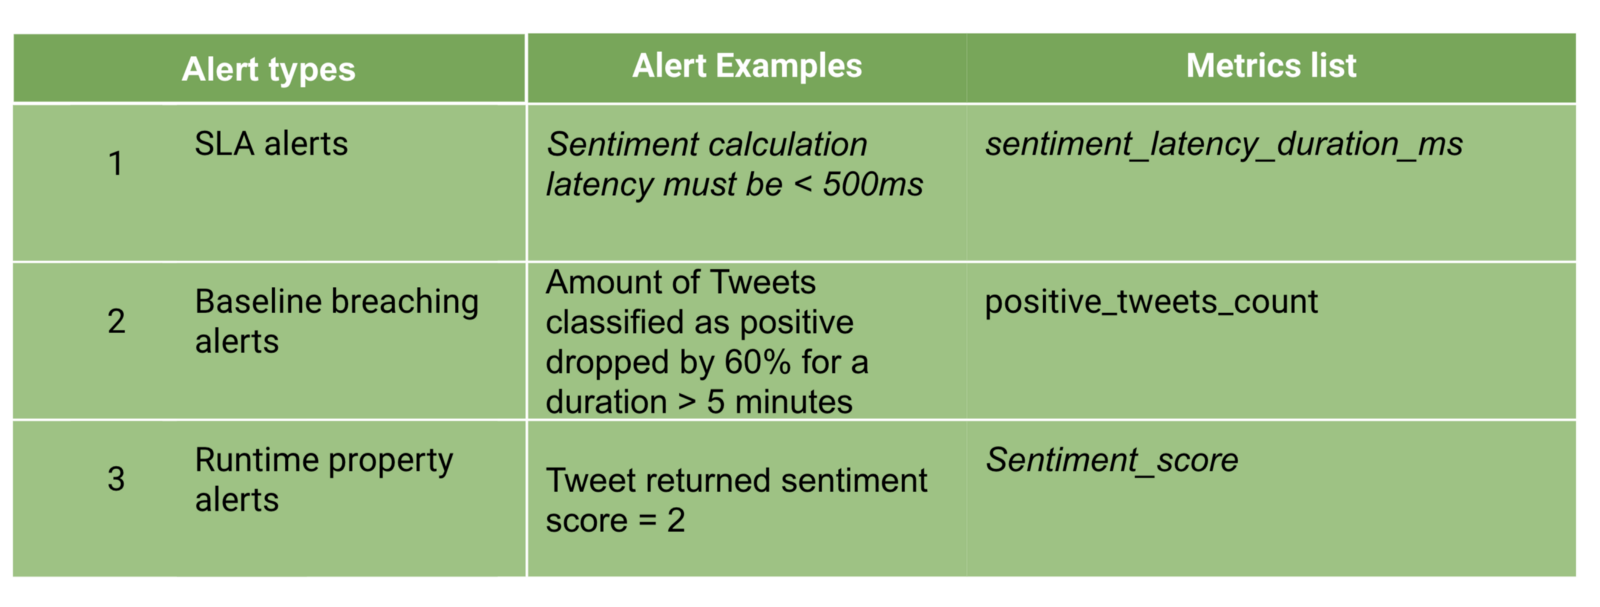 Alerts types to Metrics list
SLA Alerts
 SLA alerts in reality
SLA alerts surround the places in our system where an SLA is specified to meet explicit customer or internal requirements (i.e availability, throughput, latency, etc.). SLA breaches involve paging RND and waking people up, so try to keep the alerts in this list to a minimum.
Also, we can define Degradation Alerts in addition to SLA Alerts.
Degradation alerts are defined with lower thresholds then SLA alerts, and are therefore useful in reducing the amount of SLA breaches — by giving you a proper heads-up before they happen.
An example of an SLA alert would be, “All sentiment requests must finish in under 500ms.”
An example of a Degradation Alert will be: “All sentiment requests must finish in under 400ms”.
These are the alerts I defined:
- Latency — I expect the 90th percentile of a single request duration not to exceed 300ms.
- Success/Failure ratio of requests — I expect the number of failures per second, success per second, to remain under 0.01.
- Throughput — I expect that the number of operations per second (ops) that the application handles will be > 200
- Data Size — I expect the amount of data that we store in a single day should not exceed 2GB.
200 ops 60 bytes(Size of Sentiment Result) 86400 sec in a day = 1GB < 2GB
Baseline Breaching Alerts
These alerts usually involve measuring and defining a baseline and making sure it doesn’t (dramatically) change over time with alerts.
For example, the 99th processing latency for an event must stay relatively the same across time unless we have made dramatic changes to the logic.
These are the alerts I defined:
- Amount of Positive or Neutral or Negative Sentiment tweets — If for whatever reason, the sum of Positive tweets has increased or decreased dramatically, I might have a bug somewhere in my application.
- All latency \ Success ratio of requests \ Throughput \ Data size must not increase\decrease dramatically over time.
Runtime Properties Alerts
I’ve given a talk about Property-Based Tests and their insane strength. As it turns out, collecting metrics allows us to run property-based tests on our system in production!
Some properties of our system:
- Since we consume messages from a Kafka topic, the handled offset must monotonically increase over time.
- 1 ≥ sentiment score ≥ 0
- A tweet should classify as either Negative \ Positive \ Neutral.
- A tweet classification must be unique.
These alerts helped me validate that:
- We are reading with the same group-id. Changing consumer group ids by mistake in deployment is a common mistake when using Kafka. It causes a lot of mayhem in production.
- The sentiment score is consistently between 0 and 1.
- Tweet category length should always be 1.
In order to define these alerts, you need to submit metrics from your application. Go here for the complete metrics list.
Using these metrics, I can create alerts that will “page” me whenever one of these properties do not hold anymore in production.
 Processing latency breached configured SLA! Oh my! ?
Let’s take a look at a possible implementation of all these metrics
import SDC = require("statsd-client");
let sdc = new SDC({ host: 'localhost' });
let senService: SentimentAnalysisService; //...
while (true) {
    let tweetInformation = kafkaConsumer.consume()
    sdc.increment('incoming_requests_count')
    let deserializedTweet: { msg: string } = deSerialize(tweetInformation)
    sdc.histogram('request_size_chars', deserializedTweet.msg.length);
    let sentimentResult = senService.calculateSentiment(deserializedTweet.msg)
    if (sentimentResult !== undefined) {
        let serializedSentimentResult = serialize(sentimentResult)
        sdc.histogram('outgoing_event_size_chars', serializedSentimentResult.length);
        sentimentStore.store(sentimentResult)
        kafkaProducer.produce(serializedSentimentResult, 'sentiment_topic', 0);
    }

}
The full code can be found here
A few thoughts on the code example above:
- There has been a staggering amount of metrics added to this codebase.
- Metrics add complexity to the codebase, so, like all good things, add them responsibly and in moderation.
- Choosing correct metric names is hard. Take your time selecting proper names. Here’s an excellent post about this.
- You still need to collect these metrics and display them in a monitoring system (like Grafana), plus add alerts on top of them, but that’s a topic for a different post.
Did we reach the initial goal of identifying issues and resolving them faster?
 YESSSS, it was!
We can now make sure the application latency and throughput do not degrade over time. Also, adding alerts on these metrics allows for a much faster issue discovery and resolution.
Conclusion
Metrics-driven development goes hand in hand with CI\CD, DevOps, and agile development process. If you are using any of the above keywords, then you are in the right place.
When done right, metrics make you feel more confident in your deployment in the same way that seeing passing unit-tests in your build makes you feel confident in the code you write.
Adding metrics allows you to deploy code and feel confident that your production environment is stable and that your application is behaving as expected over time. So I encourage you to try it out!
Some references
- Here is a link to the code shown in this post, and here is the full metrics list described.
- If you are eager to try writing some metrics and to connect them to a monitoring system, check out Prometheus, Grafana and possibly this post
- This guy wrote a delightful post about metrics-driven development. GO read it.