
Today I'm joined by Dr. Curran Kelleher. He's a data visualization expert and has taught a number of in-depth data visualization courses on freeCodeCamp's YouTube channel.
We talk about what it's like to get a Ph.D. under one of the pioneers of data visualization.
We also talk about how he uses his visualization skills in industry, his many years living in India, and his love of teaching.
I think you're going to walk away with a deeper understanding of data, the human brain, and how we process information. You'll also learn some practical career tips.
I hope these weekly freeCodeCamp podcasts are firing you up about learning more about technology.
Be sure to follow The freeCodeCamp podcast in your favorite podcast app. And share this podcast with a friend. Let's inspire more folks to learn to code and build careers for themselves in tech.
You can listen to the podcast in Apple Podcasts, Spotify, or your favorite podcast app. You can also listen to the podcast below, right in your browser:
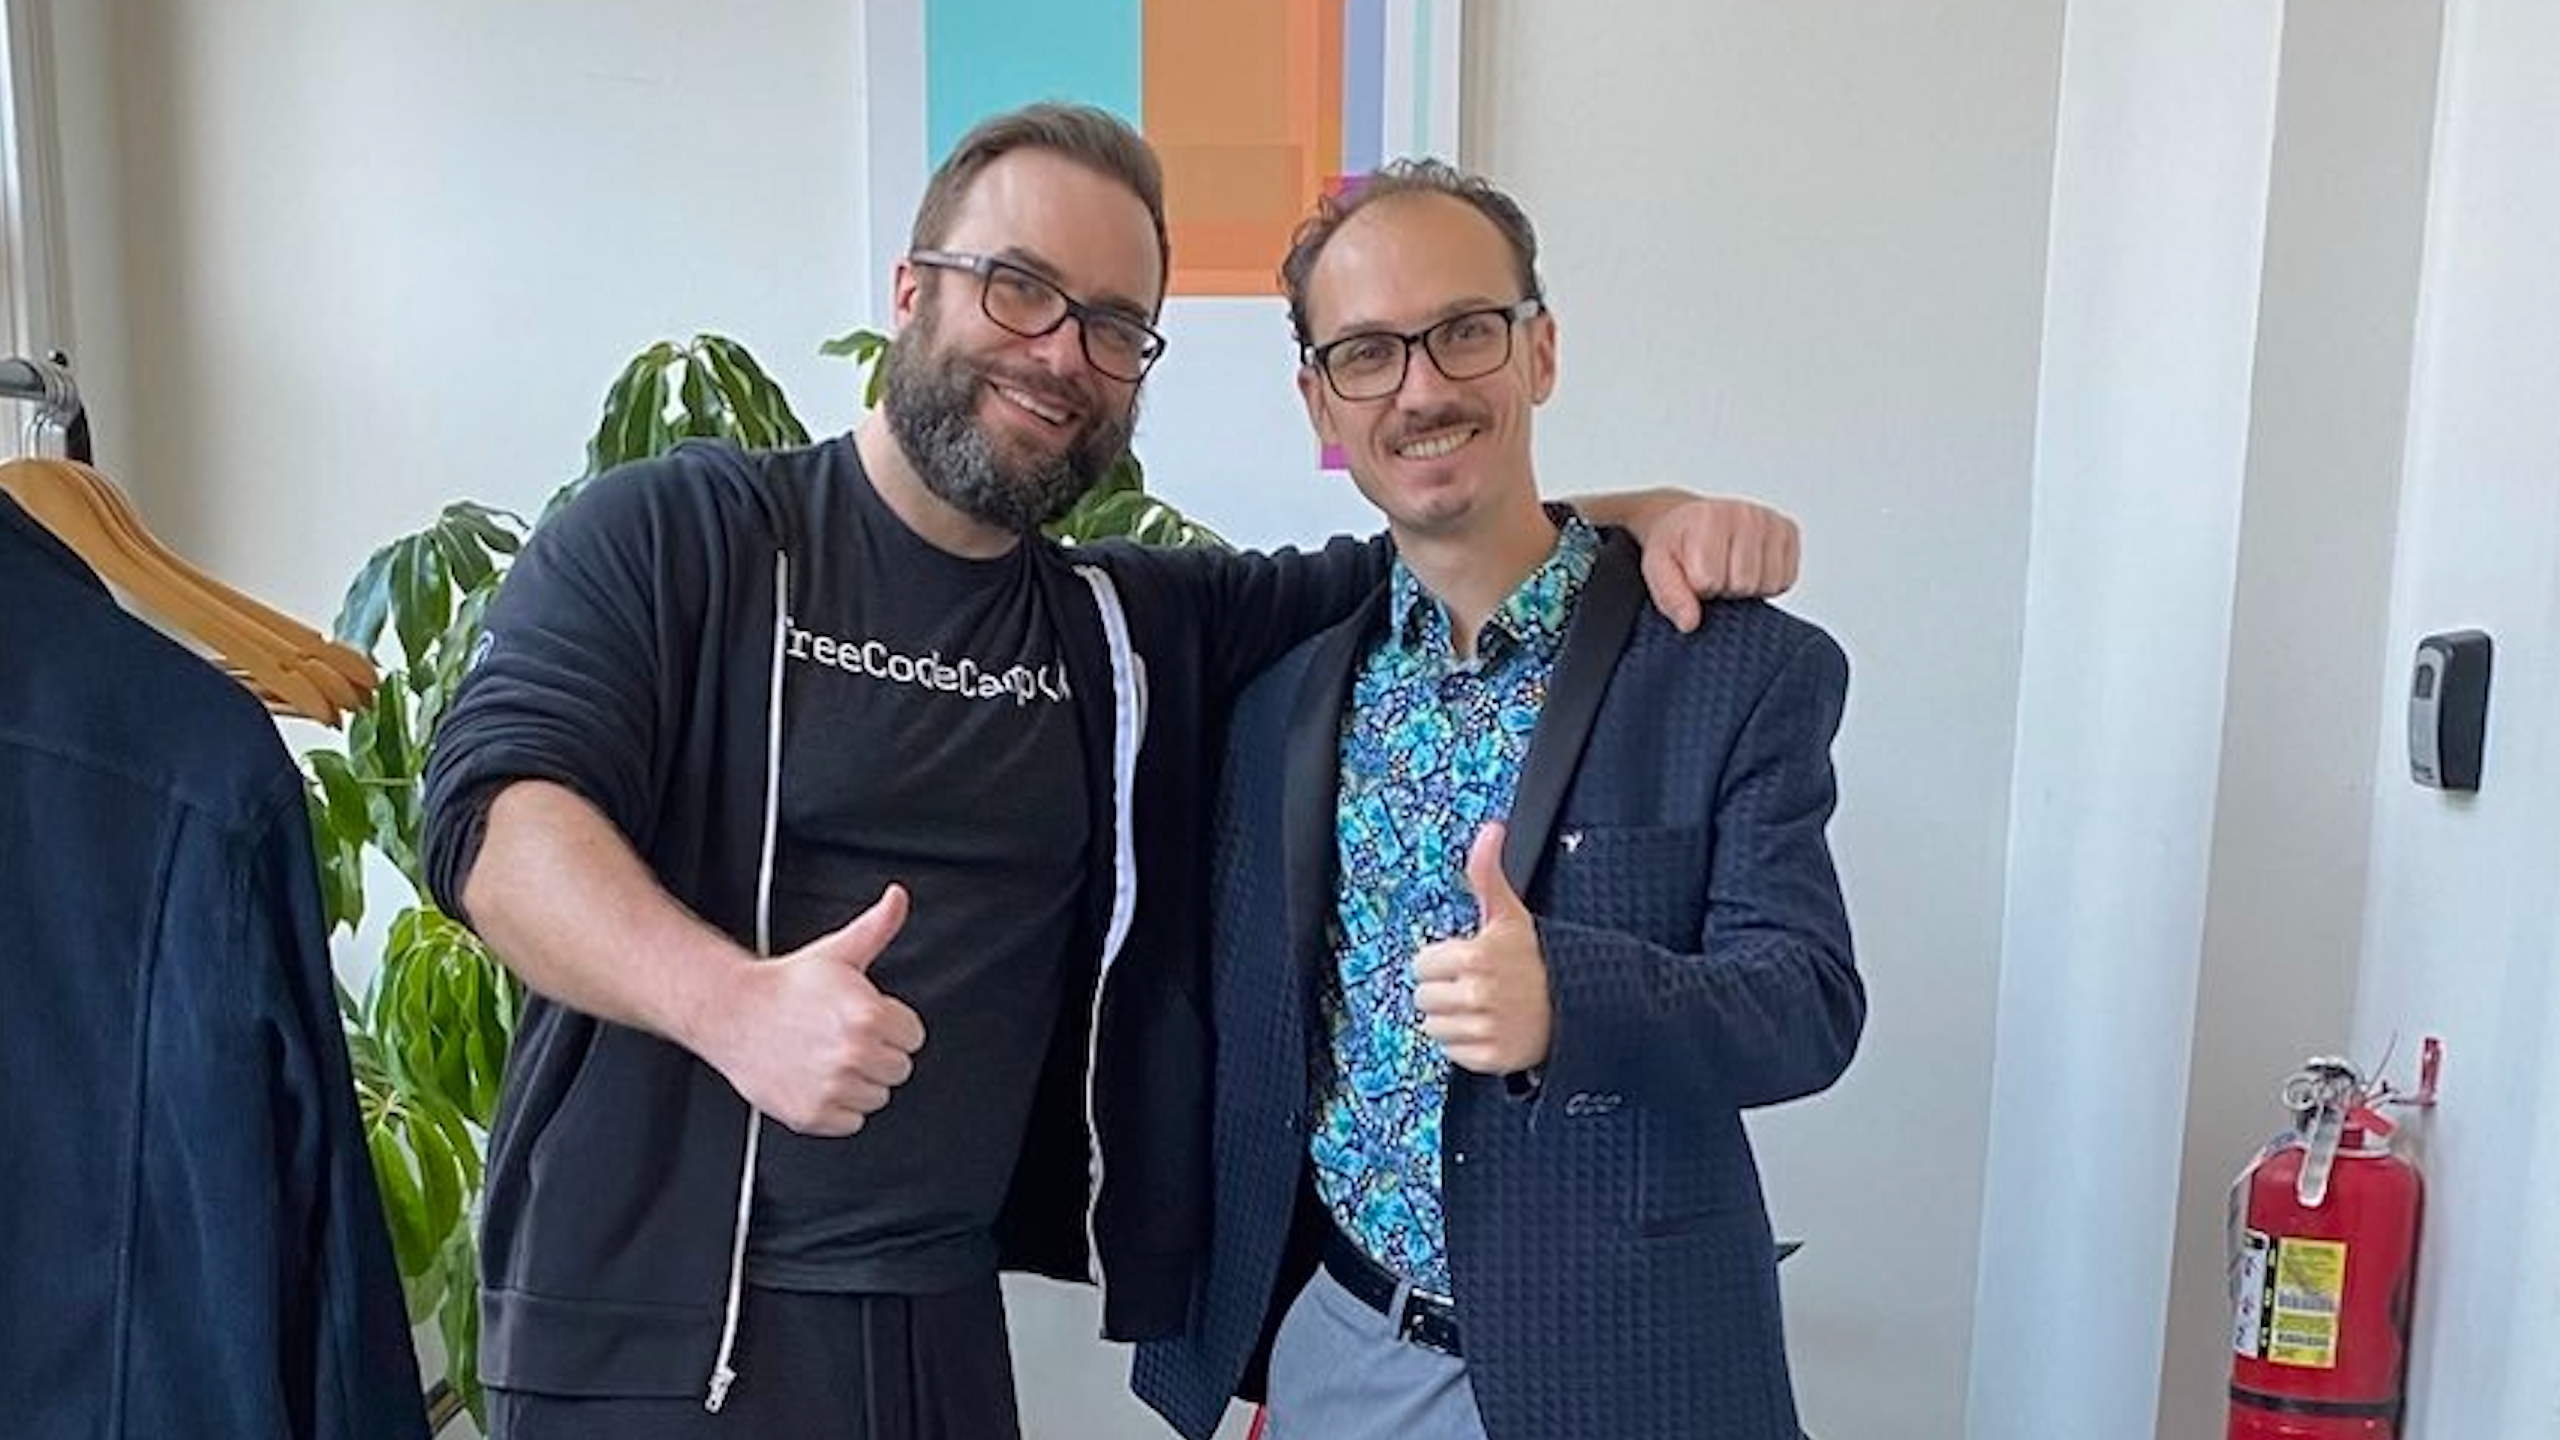 Me with Dr. Curran Kelleher at South Park Commons in NYC
Some relevant links from our discussion:
Curran's 20-hour Data Visualization with D3 course on freeCodeCamp
"Semiology of Graphics: Diagrams, Networks, Maps" book that Curran mentions