
By Dipto Karmakar
If you want to be sure that your site works well regardless of the level of traffic it has, then you should do load testing.
In simple terms, load testing is a subset of performance testing. It is used to recognize the upper limit of a web application and check how the system can handle a heavy load.
If you’ve ever asked yourself: How will this website behave in terms of performance under extreme load if too many users access it simultaneously? then read on, because this is exactly the question we will answer in this article.
Below we'll show you three different tools with which this type of testing can be performed.
But before we start using these tools, let’s see first what data we need to collect.
When it comes to performance testing, these are the indicators that best describe our application:
- Response time - the amount of time between a request and a response.
- Average load time - the average response time.
- Peak response time - the longest response time.
- Throughput / Requests per second (rps) - number of requests handled per second
- Memory / CPU utilization - the amount of memory/CPU consumed by the host machine.
- Error rate - errors / requests ratio.
- Concurrent users - number of active users/sessions in the application.
- Percentiles (50% and 95%) - the percentage of requests that had a better time than a certain value.
LoadTest
 loadtest
The first tool is an npm package called loadtest.
To use this tool you need to have NodeJS installed on your machine, then you need to run this command:
npm install -g loadtest
LoadTest is by far the simplest and easiest tool from this list to setup and use. All you need to do is to open a command line and run:
loadtest [-n requests] [-c concurrency] URL
For demo purposes we’ll use my favorite website blank.org, which is a blank web page mostly used for testing purposes.
The following command will send a number of maximum 60 requests from 30 different concurrent clients:
loadtest -n 60 -c 30 https://blank.org
!Note: the number of concurrent users does not mean the number of simultaneous requests.
Concurrent users/sessions represent the number of users connected to the application that makes requests at a regular interval but simultaneously.
The output of the previous command will be the following:
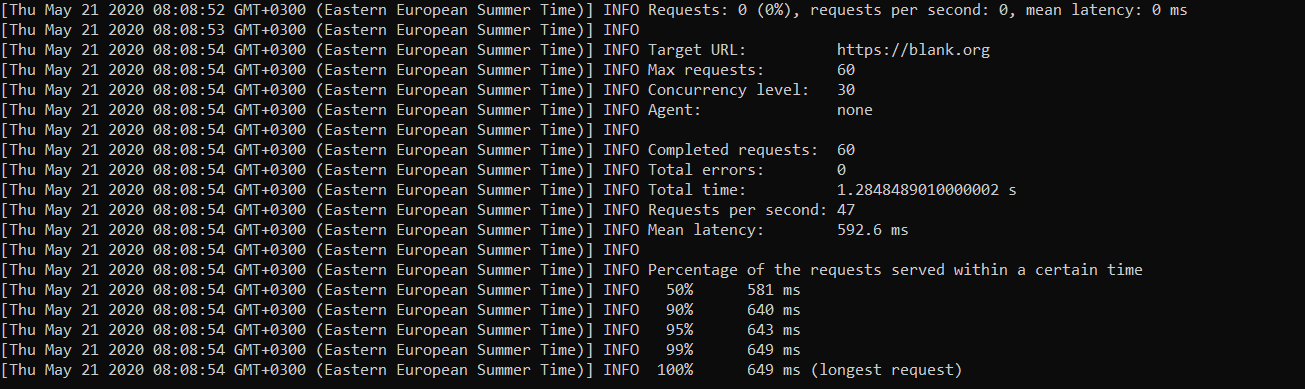
This tool offers us information about:
- percentiles (50,90,95,99 and 100%)
- mean latency
- error rate
We can see that for blank.org the time in milliseconds for 50% from our requests (30 requests) is less then 581 ms and the response for the longest request took 649 ms.

Loadmill
 Loadmill
Another tool that we can use is Loadmill, a free web-based tool for testing. It also comes with an npm package if we want to write the code ourselves, but for demo purposes we’ll go with the online tool.
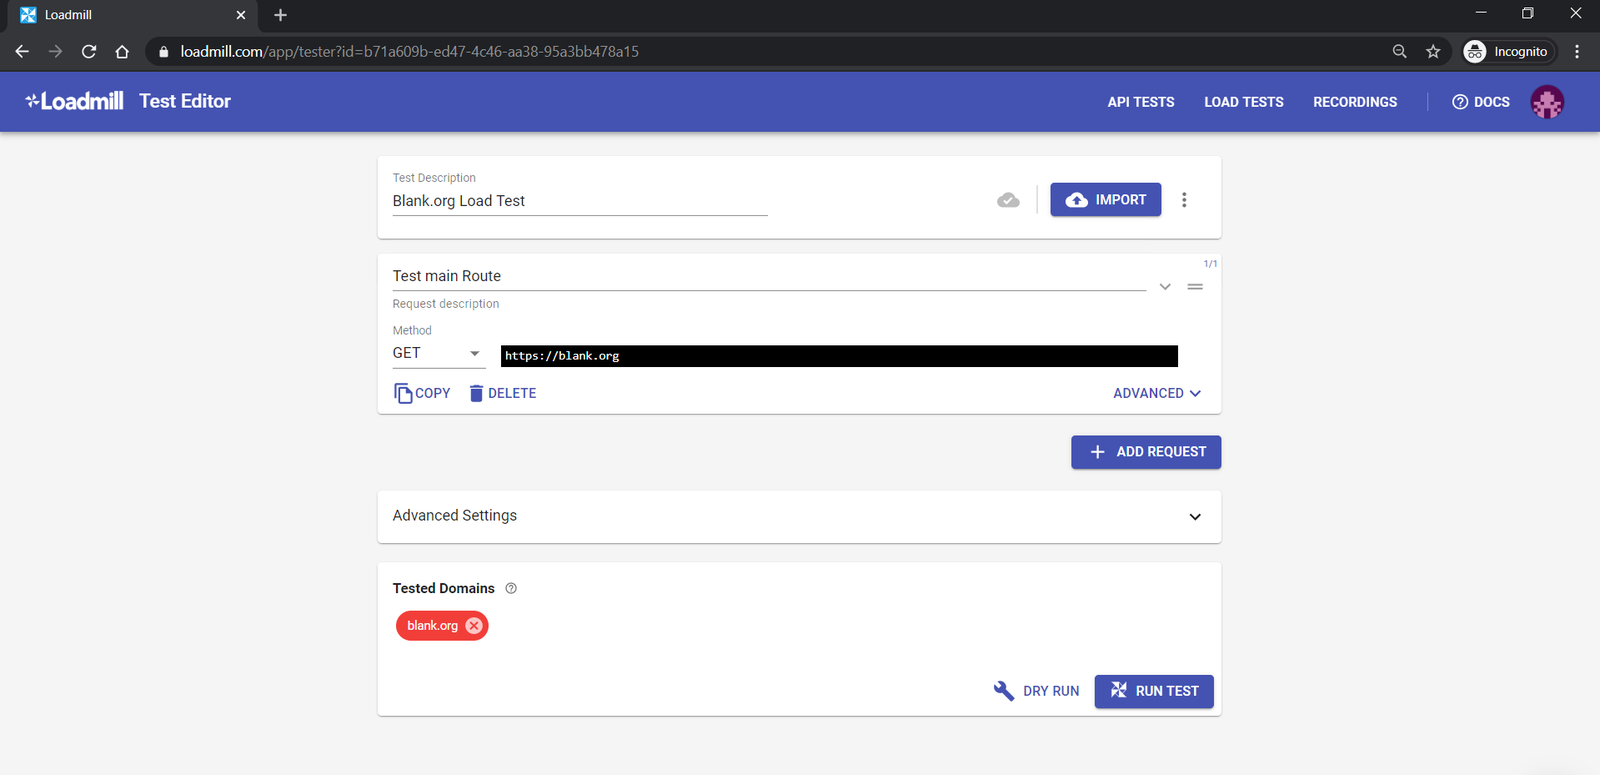
To do a load test using Loadmill all we need to do is it to create a request in the the corresponding panel and supply the URL of our application.
The next step is to hit the Run Test button and configure the number of concurrent sessions and test duration.
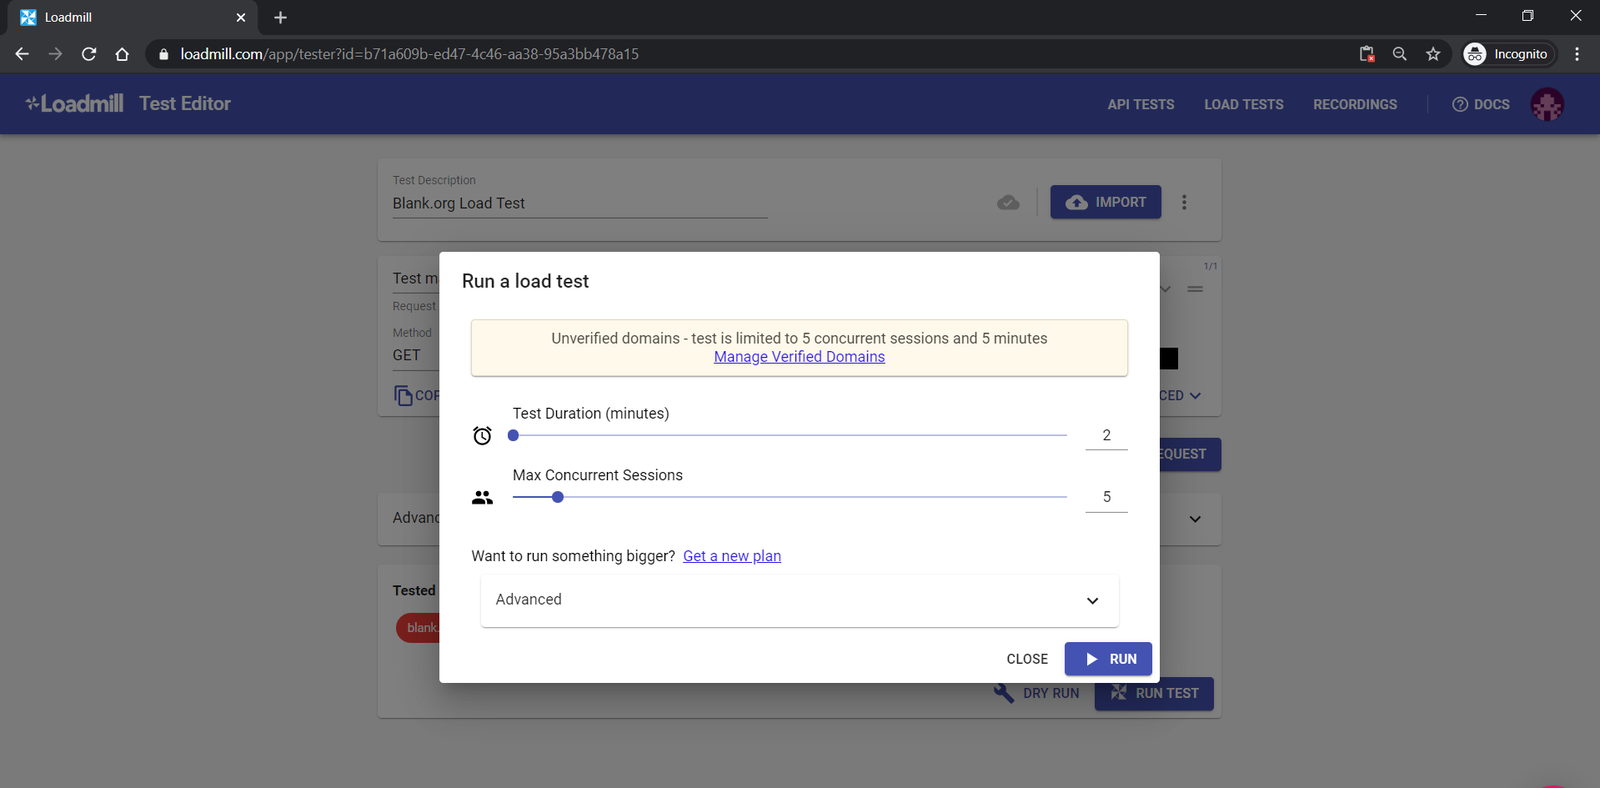
You’ll notice that the blank.org domain appears in a red button. That's because it's an unverified domain. After all I don't own the blank.org web site. Because of this, there is a certain maximum load threshold that we can send to that site.
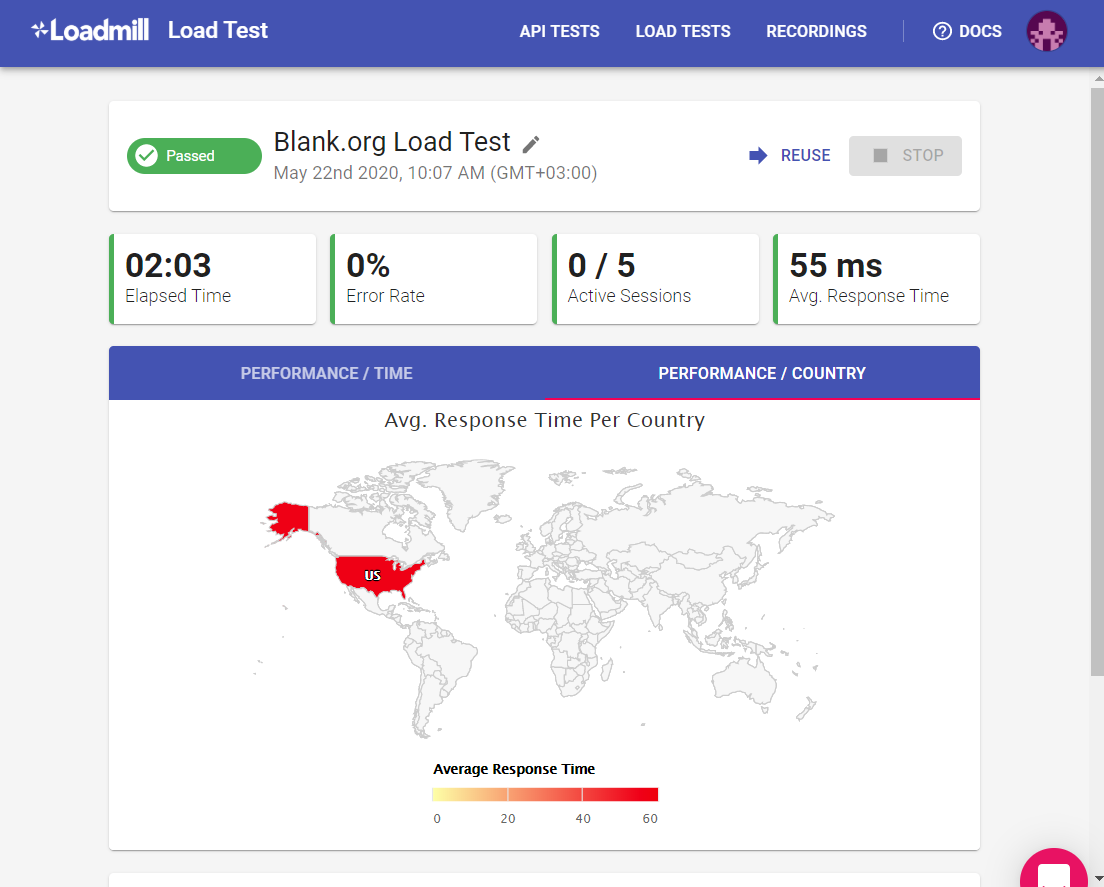
With this configuration, we’ll see how blank.org behaves when 5 concurrent sessions try to use the application in a 2-minute time frame.
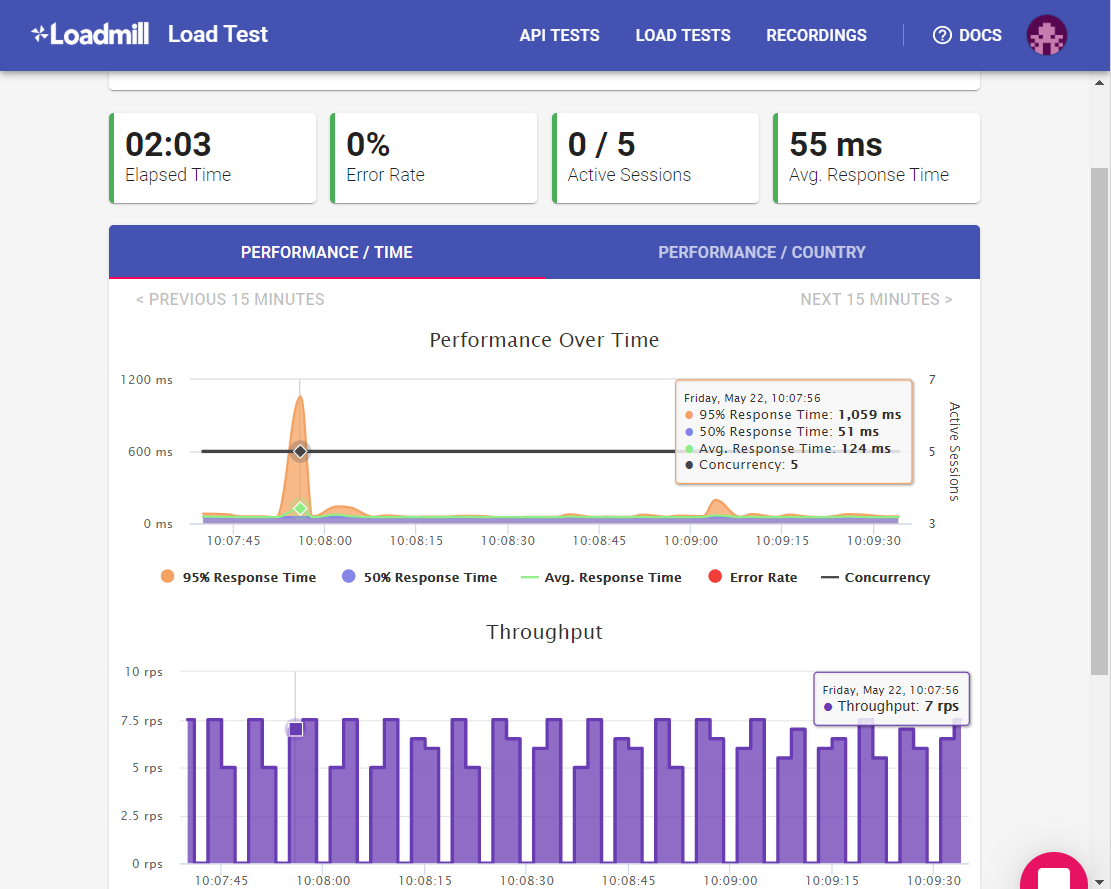
As an output we can see the performance over time:
- all requests had an average response time of 55 ms,
- we had a peek at the beginning where 95% of the requests had a response time lower than 1,059 ms and 50% of the requests had a response time lower than 51 ms
This means that the longest time for a response took more than 1 second.
At the same time, we can see the error rate and throughput in rps (requests per second) of our sessions. That’s the number of requests sent by our concurrent users in a 1-second time frame.
Now you may ask yourself, why this big discrepancy between the results from the first tool and this one?
Here's an extremely important thing to pay attention to, namely the relevance and correctness of the data.
You need to be realistic and to try to make your tests reflect reality as much as possible.
There is more than one strategy when it comes to doing performance testing. Some tools and providers use just the local environment and others spin up virtual machines for each concurrent user.
Loadmill differs from other services due to its usage of real web traffic to generate the load on the tested server. In other words the traffic that goes to the targeted website comes from real browsers.
The Loadtest package is strongly related to the local machine on which you run the tests and you can go as far as your CPU allows you to.
As you saw I run the tests using loadtest on my machine using the command line. The response time was 10 times bigger than the response time using Loadmill. Let’s find out why.
If we open developer tools on blank.org we can find it’s IP, and that’s 18.217.80.105. Using this value we can perform an IP lookup and see that the server is located in Ohio, USA ??.
We know that the response time is the time measured between a request and a response. So the request goes to the server and from the server back to the agent (browser).
With the first tool, we got approximately 500 ms, because I’m sending the requests from my machine. So the requests must travel back and forth almost 11000 miles.
If we go on the second panel of our test results PERFORMANCE / COUNTRY. We see that all the requests were sent from the USA. That’s why the significantly smaller response time.
Remember when testing that it is best to simulate conditions as close to reality as possible so that the data is as accurate as possible.
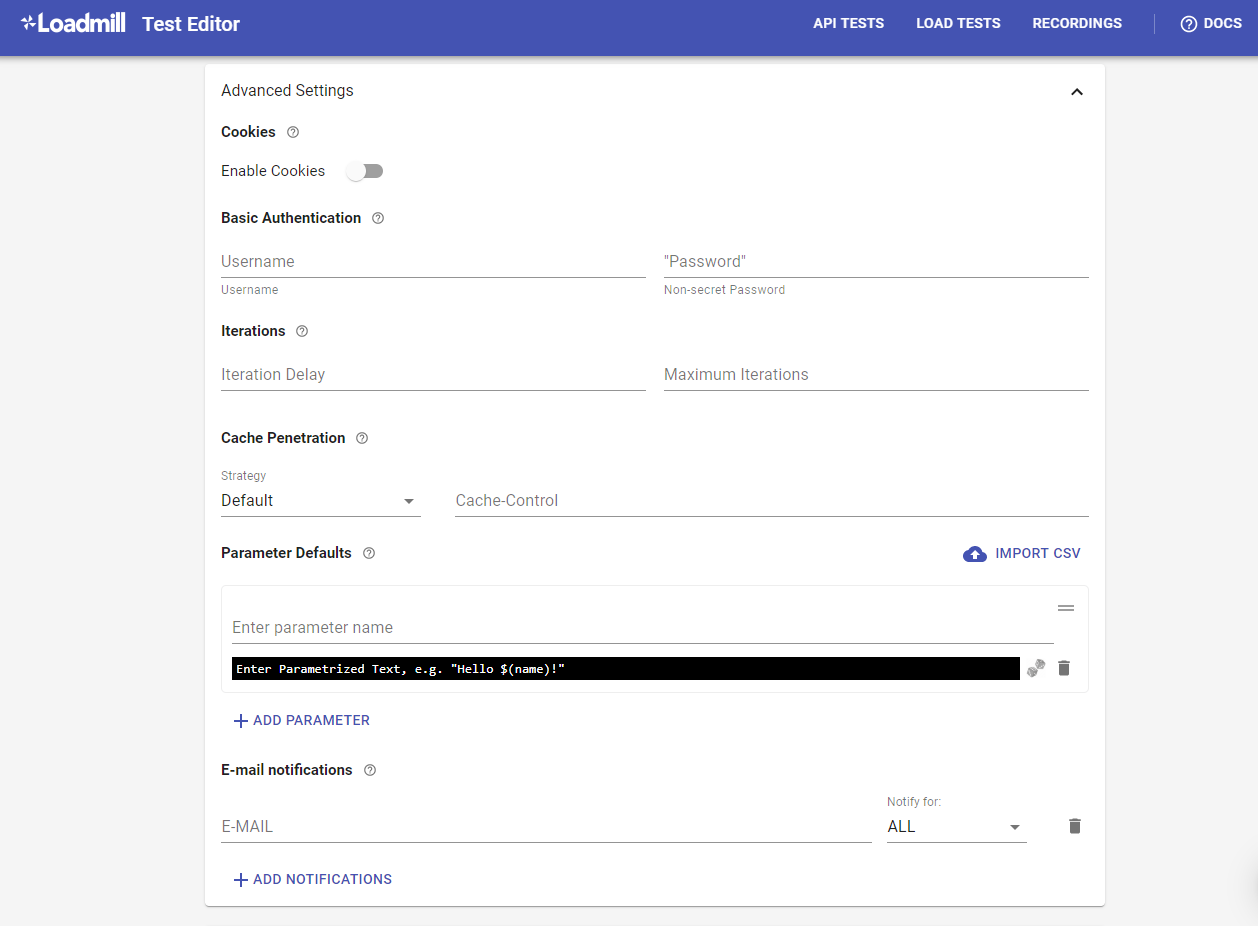
Before we go to the next tool, I want to mention one more thing about Loadmill, and that’s the fact that it can be configured to do much more than this.
We can create complex load test scenarios with multiple requests containing parameters and data including basic authentication and email notifications.
Apache JMeter
 Apache JMeter
The last tool in our list is Apache JMeter, which is an open-source Java-based application for performance testing. This application requires an installation and is a little harder to configure. Therefore the following information is separated into steps.
Step 1 - Download and Install
Download the binaries archive in your computer and unzip the content.
Then, go inside the bin folder and run the jmeter.bat file two times. One time to configure the tool and the second time to start it.
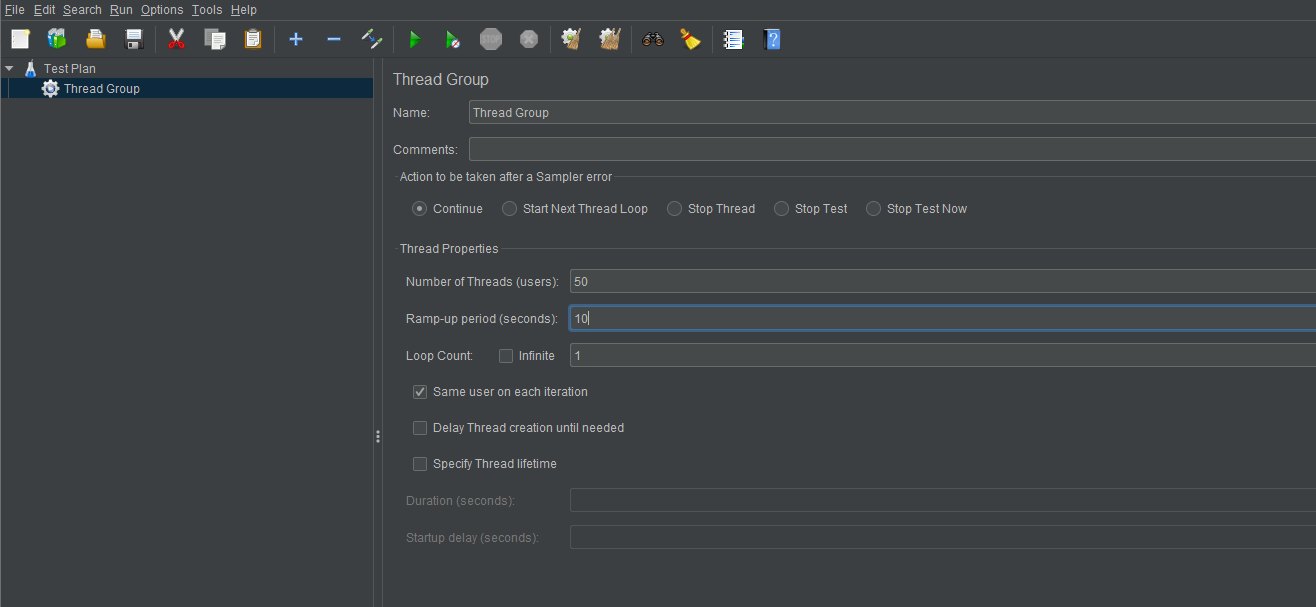
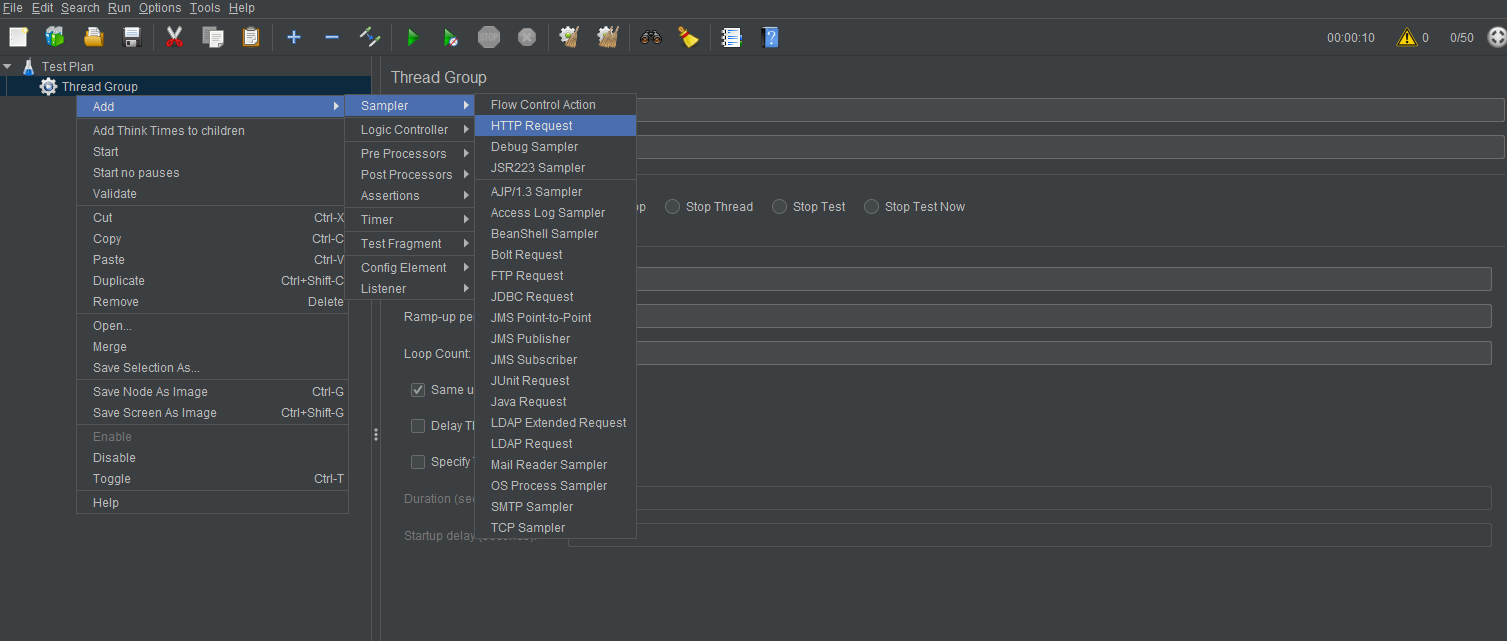
Step 2 - Add Thread Group
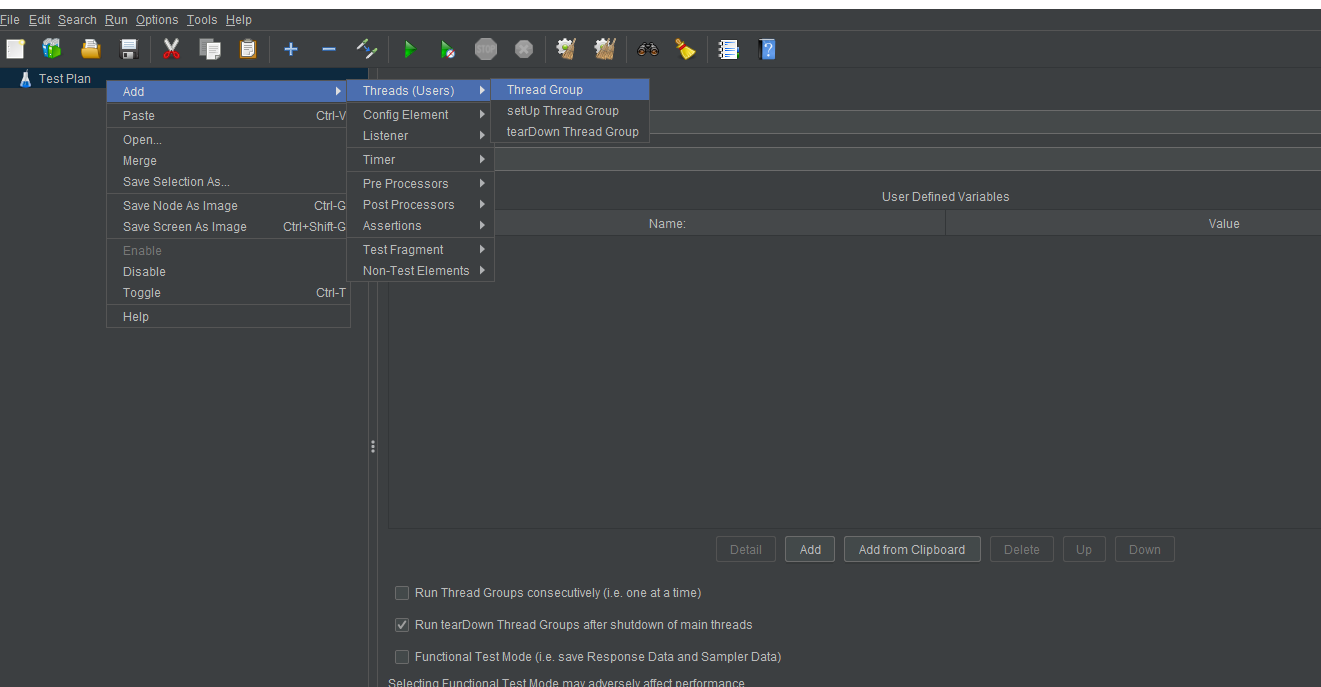
The Thread Group has three particularly important properties that influence the load test:
- Number of Threads (users): The number of concurrent sessions that JMeter will create.
- Ramp-Up Period (in seconds): The duration of the test.
- Loop Count: The number of times to execute the test.
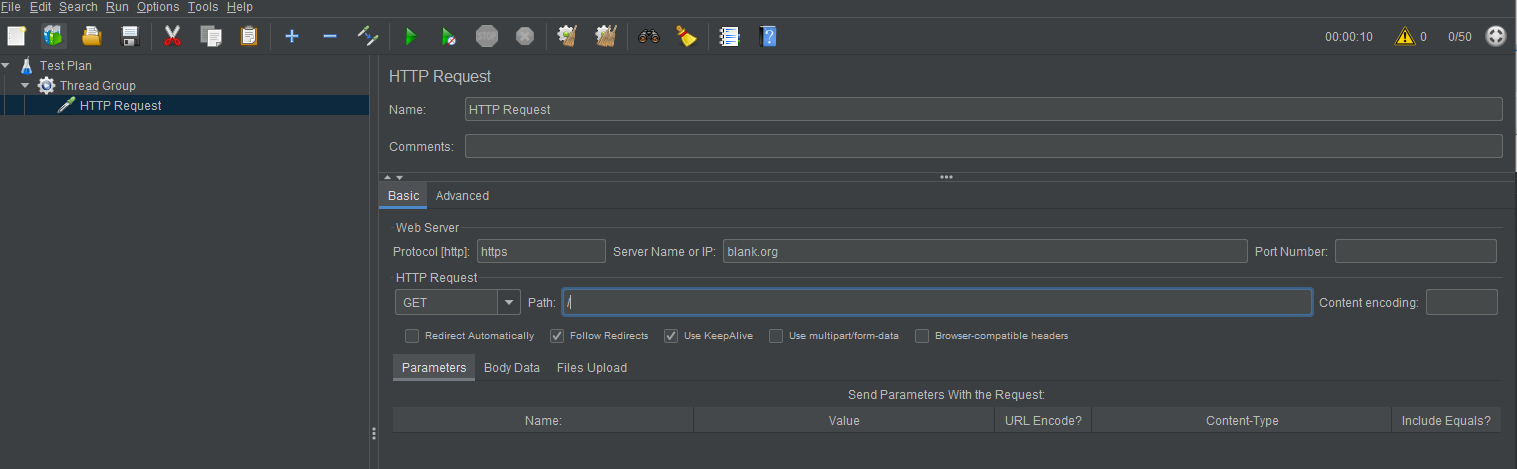
Step 3 - Add an HTTP Request Sampler
In HTTP Request Sample, under the HTTP Request section, fill in the Server Name, Protocol and Path of the application you want to test.
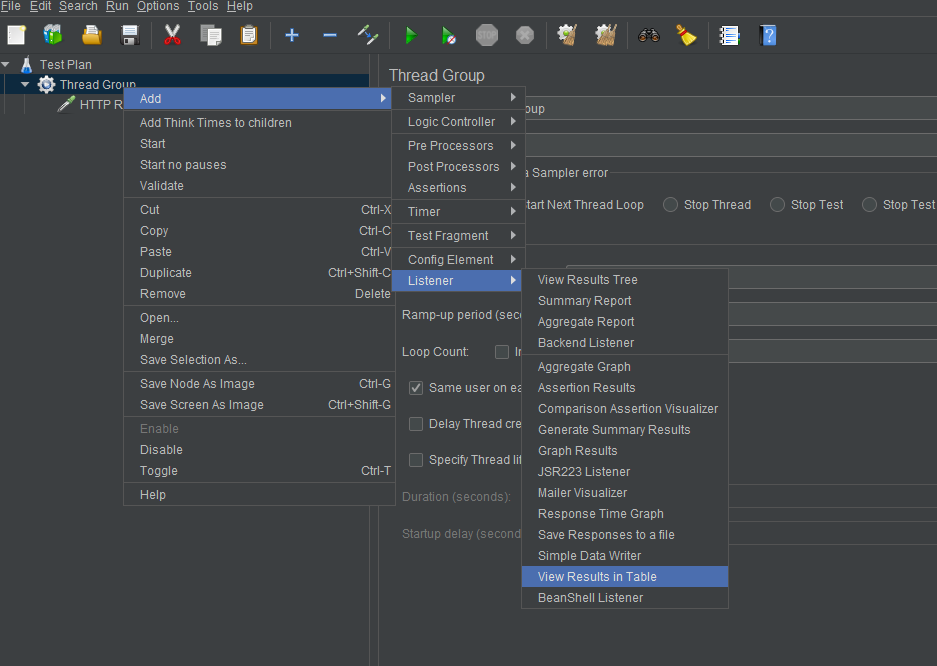
Step 4 - Add a View
In JMeter, you’ll be using listeners to output the results of a performance test. There are a variety of listeners available, and you can add others by installing plugins. Let’s use the Table in this case.
Step 5 - Run the test
Run the test by clicking on the green triangle.
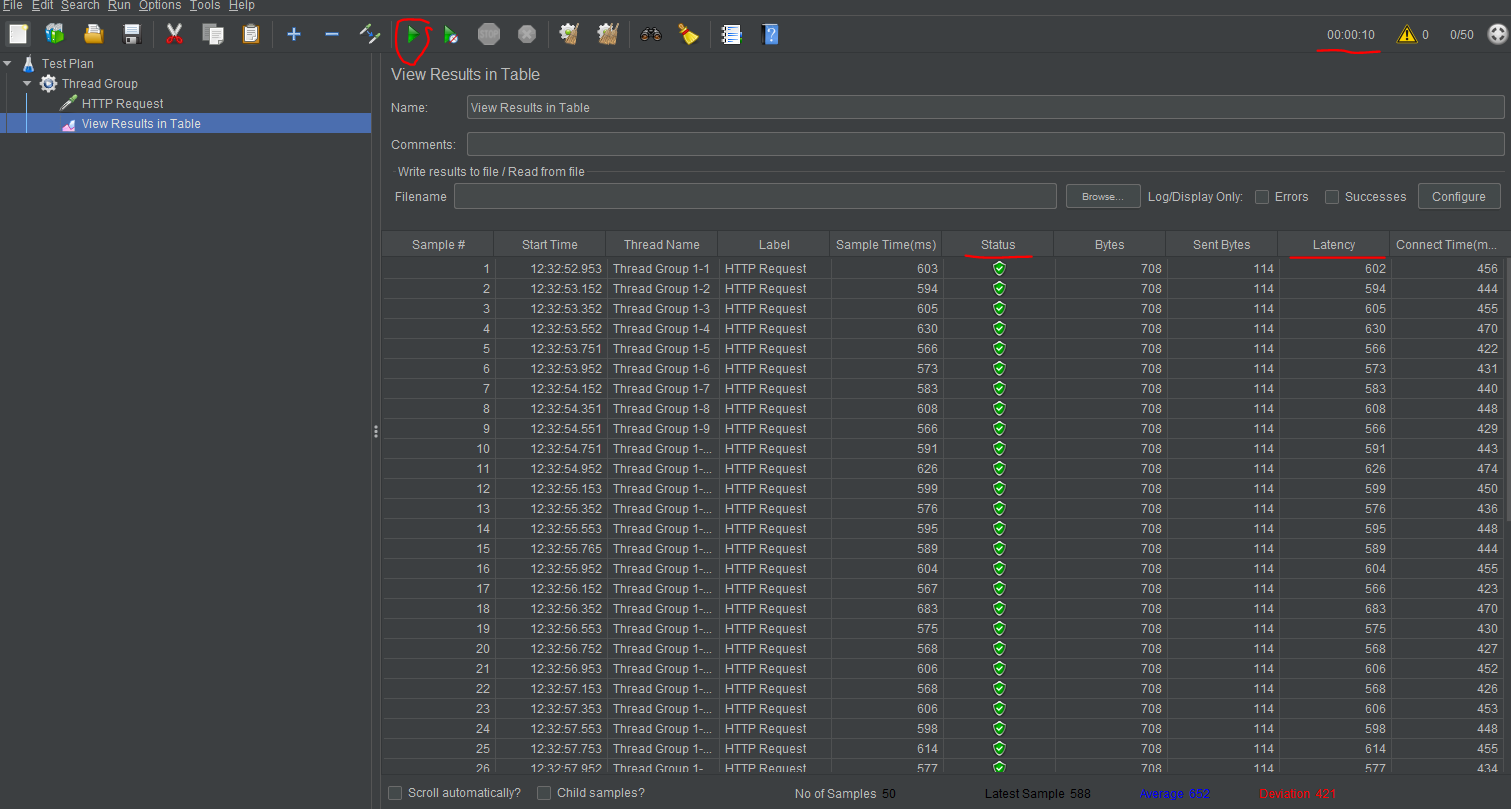
Now we can analyze our test.
Firstly we can see in the top right corner that the test runs for 10 seconds, exactly as we specified in the options before.
After that, the columns that we are most interested in are Status and Latency.
- Latency: The number of milliseconds that elapsed between the request and when an initial response was received.
- Status - Represents the status of the request, if it was successful or not. It’s used to calculate the error rate.
As a side note, we can observe that the values are similar to the ones obtained using loadtest. That’s because they work in the same way.
Remaining indicators
With these tools, we acquired information about most of the indicators which we talked about at the beginning.
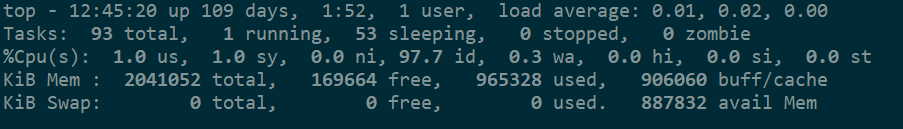
Lastly, if we want to get information about Memory / CPU utilization too, then we need to connect to our machine where the application is hosted and run the following commands:
$ top
This command will show you both CPU utilization as a percentage and Memory utilization.
or
$ free -h
This command will only show you data about Memory but is easier to read.

Conclusion
There are plenty of tools that can be used to carry out performance testing. What is important is to find one that is simple to use, but that also shows you the most accurate data for your case. And remember, always make your tests simulate conditions as close to reality as possible.