

In the field of machine learning, there are two approaches: supervised learning and unsupervised learning. And it all depends on whether your data is labeled or not. Labels shape the way models are trained and affect how we gather insights from them.
In this article, we'll explore the concepts of supervised and unsupervised learning, and highlight their key differences.
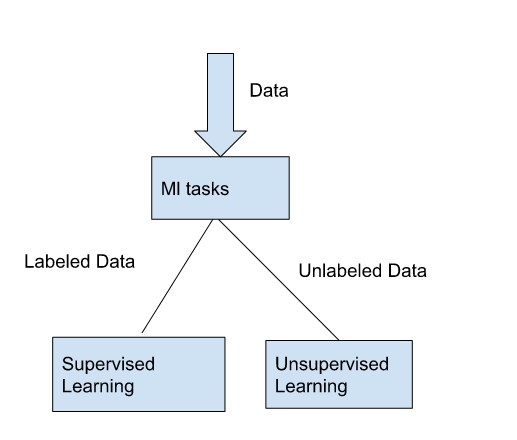 Types of learning in machine learning
Supervised Learning: Guided by Labeled Data
Supervised learning is like having a helpful teacher by your side. In this approach, we have labeled data, which means each piece of data comes with a special tag or label.
Think of it like having answers to the questions before the big test. You can learn from these labeled examples and make predictions or classifications on new, unseen data.
Supervised learning revolves around the use of labeled data, where each data point is associated with a known label or outcome. By leveraging these labels, the model learns to make accurate predictions or classifications on unseen data.
A classic example of supervised learning is an email spam detection model. Here, the model is trained on a dataset where each email is labeled as either "spam" or "not spam". By learning from these labeled examples, the model can generalize its knowledge and accurately classify incoming emails as spam or legitimate.
Another instance of supervised learning is a handwriting recognition model. By providing the model with a dataset of handwritten digits along with their corresponding labels, the model can learn the patterns and variations associated with each digit. Consequently, it becomes proficient in recognizing handwritten digits in new, unseen samples.
Categorical and Continuous Labels
Categorical labels are used when the target variable falls into a finite number of distinct categories or classes. These labels are also known as nominal or discrete labels.
Let's break down some terms to make it easier to understand. A categorical label has a discrete set of possible values, like "is a cow" or "is not a cow." It's like saying something can only be one thing or another.
Discrete is a term taken from statistics, referring to outcomes that can only take on a finite number of values, like days of the week. It's like having a limited number of options to choose from.
Continuous labels, also known as numerical labels, are used when the target variable represents a continuous or real-valued quantity. These labels can take on any numeric value within a certain range.
This means that a continuous label doesn't have a discrete set of possible values. There can be an unlimited number of possibilities. Think of it like a sliding scale instead of strict categories.
It's important to note that the type of labels determines the type of machine learning problem you are dealing with.
Categorical labels are associated with classification problems, where the goal is to assign a category or class to a given input.
Continuous labels are associated with regression problems, where the goal is to predict a continuous value.
But there are also hybrid problems that involve both categorical and continuous labels, such as multi-label classification or multi-output regression.
Supervised Learning Algorithms
Here are some awesome supervised learning techniques you should know:
Linear Regression
Linear regression is a fundamental technique in machine learning used to model the relationship between a dependent variable and one or more independent variables. It aims to find the best-fitting straight line that represents the linear relationship between the variables.
Imagine you have a bunch of points on a graph. Each point has two values: one on the x-axis and one on the y-axis. For example, let's say we have variables representing the number of hours studied (x) and the corresponding test scores (y) for different students.
Linear regression is a way to draw a straight line that best represents the overall trend or relationship between these two variables. We want to find a line that comes as close as possible to all the points.
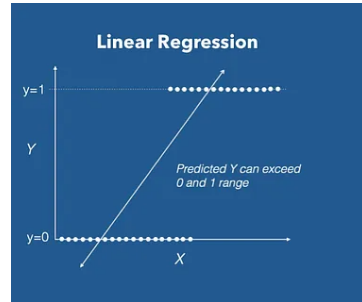 Image of a graph showing linear regression
Linear regression is used in many real-world situations. For example, predicting house prices based on factors like area, number of rooms, and location.
 Image of a house and a compass
Logistic Regression
Logistic regression is employed when the target variable is binary or categorical. It predicts the probability of an instance belonging to a particular class. It is commonly used for tasks such as sentiment analysis or spam detection.
To understand logistic regression, let's imagine we have a dataset with some features and corresponding labels. For instance, we might have information about students, such as their study time and whether they passed or failed an exam.
In logistic regression, we're interested in predicting a binary outcome, like "pass" or "fail." The goal is to find a relationship between the input features (for example, study time) and the probability of the outcome (for example, the probability of passing the exam).
Instead of a straight line like in linear regression, logistic regression uses a special curve called the sigmoid or logistic function. This curve ranges between 0 and 1 and has a characteristic S-shaped form. It maps any input value to a probability value between 0 and 1.
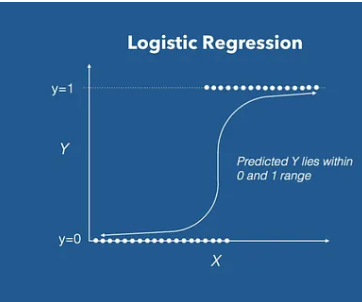 Image of a graph showing logistic regression
Decision Trees
Decision trees are graphical structures that help make decisions or predictions based on a set of conditions. They split the data into branches, where each branch represents a decision or outcome. Decision trees are widely used for classification tasks, and can handle both categorical and continuous data.
The decision tree starts with a single node, called the root node, representing the entire dataset. Each internal node of the tree represents a decision based on a specific feature, and each branch represents the possible outcomes of that decision. The leaves of the tree represent the final predictions or outcomes.
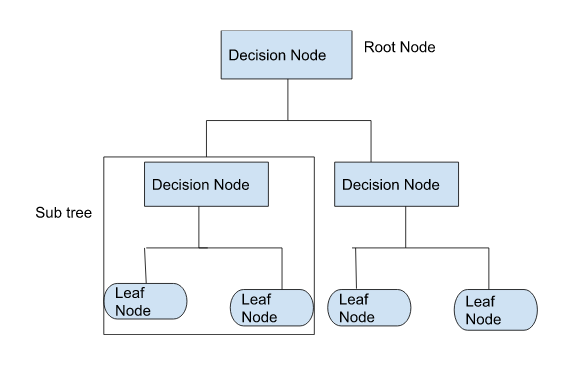 Illustration of a decision tree
Imagine you are a detective trying to solve a mystery and you have a list of clues or features to consider. Each clue could be a piece of evidence that helps you determine whether a suspect is guilty or not guilty.
A decision tree is like a set of questions that guide you through the investigation process, helping you make decisions based on the clues.
For example, let's say you have the following clues:
- Clue 1: Is there a weapon at the crime scene?
- Clue 2: Did the suspect have a motive?
- Clue 3: Are there any eyewitness accounts?
Starting with the root question, you would ask if there is a weapon at the crime scene. If the answer is "yes," you follow one branch of the decision tree. If the answer is "no," you follow a different branch.
Let's consider the "yes" branch:
- If there is a weapon at the crime scene, you move to the next question: Did the suspect have a motive? Depending on the answer, you follow the corresponding branch.
- If the suspect had a motive, you continue to the next question: Are there any eyewitness accounts? Again, you follow the appropriate branch based on the answer.
Each question or clue helps you narrow down the possibilities and make a decision at each step. Eventually, you reach a leaf node, which represents your final decision or prediction.
For example, if you find a weapon at the crime scene, the suspect had a motive, and there are eyewitness accounts, the decision tree might lead you to conclude that the suspect is guilty. On the other hand, if any of the clues point in the opposite direction, the decision tree might lead you to conclude that the suspect is not guilty.
In this detective analogy, the decision tree acts as a logical flowchart, helping you make decisions based on the available evidence or features.
Similarly, in machine learning, decision trees use input features to make predictions or classifications based on a hierarchical set of if-else conditions.
             Start
               |
         Is there a weapon at the crime scene?
               |
        /                  \
       /                    \
  Yes /                      \ No
     /                        \
    |                 Did the suspect have a motive?
    |                      |
   Yes                    No
    |                      |
    |                 Are there any eyewitness accounts?
    |                      |
    |                       \
   Yes                       No
    |                        |
   Guilty                 Not Guilty
Unsupervised Learning: Extracting Hidden Patterns from Unlabeled Data
Now, get ready to unleash your inner Sherlock Holmes because unsupervised learning is all about uncovering hidden mysteries in your data.
In this approach, we don't have any labels or answers beforehand. It's like being presented with a puzzle and trying to figure out the patterns all by yourself.
Unsupervised learning deals with unlabeled data, where no pre-existing labels or outcomes are provided. In this approach, the goal is to uncover hidden patterns or structures inherent in the data itself.
For example, clustering is a popular unsupervised learning technique used to identify natural groupings within the data.
Imagine you have a dataset containing various customer attributes such as age, income, and purchasing behavior. By applying clustering algorithms to this data, you can identify distinct customer segments based on their similarities. This information can then be used to tailor marketing strategies or personalize recommendations for each segment.
Another compelling application of unsupervised learning is anomaly detection. In cybersecurity, unsupervised algorithms can analyze network traffic patterns and identify unusual or suspicious activities that deviate from the norm. By detecting anomalies, potential security breaches or cyberattacks can be preemptively addressed.
Unsupervised Learning Algorithms
Unsupervised learning algorithms can be classified into two types of problems:
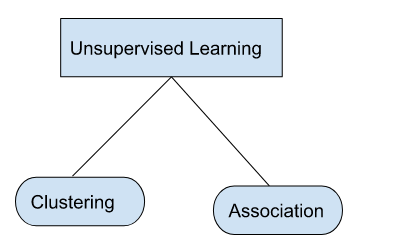 Types of unsupervised learning algorithms: clustering and association
Clustering
One popular unsupervised learning technique is clustering. Clustering is like a superpower that helps us determine if there are any naturally occurring groupings in the data. It's like finding friends who have similar interests without even knowing their names.
With clustering, you can group similar data points together and uncover meaningful patterns or structures in the data.
There are various clustering algorithms available, such as k-means, hierarchical clustering, and DBSCAN. These algorithms differ in their approaches, but the general idea is to measure the distance or similarity between data points and assign them to clusters. The number of clusters can be predefined (k-means) or determined automatically (hierarchical clustering).
Clustering has numerous applications, including customer segmentation, image recognition, document clustering, anomaly detection, and recommendation systems.
Association
Association is another technique in unsupervised learning that focuses on discovering interesting relationships or associations among different items or variables in a dataset. It aims to identify patterns that frequently appear together in the data.
The most well-known algorithm for association rule mining is Apriori. Given a dataset of transactions, Apriori finds sets of items that occur together frequently and derives association rules from them.
An association rule consists of an antecedent (or left-hand side) and a consequent (or right-hand side), indicating the presence of certain items implying the presence of other items.
For example, in a market basket analysis, association rules can be derived to identify items that are often bought together. These rules can help in making recommendations, optimizing store layouts, or understanding customer behavior.
Association analysis can also be extended to more complex scenarios, such as sequential patterns, where the order of item occurrences is important.
Both clustering and association are unsupervised learning techniques that help to explore and analyze data without relying on predefined labels or classes. They play crucial roles in pattern discovery, data exploration, and gaining insights from unlabeled datasets.
Conclusion
Supervised and unsupervised learning represent two distinct approaches in the field of machine learning, with the presence or absence of labeling being a defining factor.
Supervised learning harnesses the power of labeled data to train models that can make accurate predictions or classifications.
In contrast, unsupervised learning focuses on uncovering hidden patterns and structures within unlabeled data, using techniques like clustering or anomaly detection.
Whether you are working with labeled data in supervised learning, such as email spam detection or handwriting recognition, or exploring the potential of unsupervised learning in customer segmentation or anomaly detection, understanding the underlying principles of these approaches empowers you to derive valuable insights and make informed decisions in a wide range of applications.