
Tableau and Power BI are both data visualization and business intelligence tools. You can extract data with both tools, visualize the data, analyze it, and turn it into a piece of actionable information.
In this article, you will learn what both Power BI and Tableau are in detail. I will also create a factual comparison between the two so you can identify which of them you should use for your project.
NB: This article is not a black-and-white comparison of Power BI and Tableau. There are a lot of grey areas between the two and that’s what we are going to look at the most.
What is Tableau?
Tableau became popular in the early 2000s. It is the leading data visualization and business intelligence tool for companies that want to be data-driven.
Tableau can integrate with and get data from a wide variety of sources like Microsoft Excel, Microsoft Access, and Google Analytics. It can even integrate with files like JSON, text, statistical and spatial files.
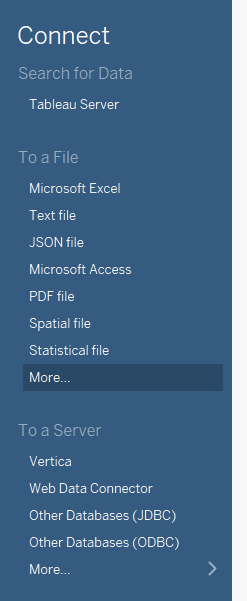
Tableau has many features, such as:
- no code data query
- drag and drop
- real-time analysis
- data filtering
- mobile view
- data connectors
- text editor
- dashboards
- team members collaboration, and tons more.
What is Power BI?
Power BI is a suite of data analysis and visualization tools and services that helps you convert data into visually interactive reports. It was made available to the public in 2011.
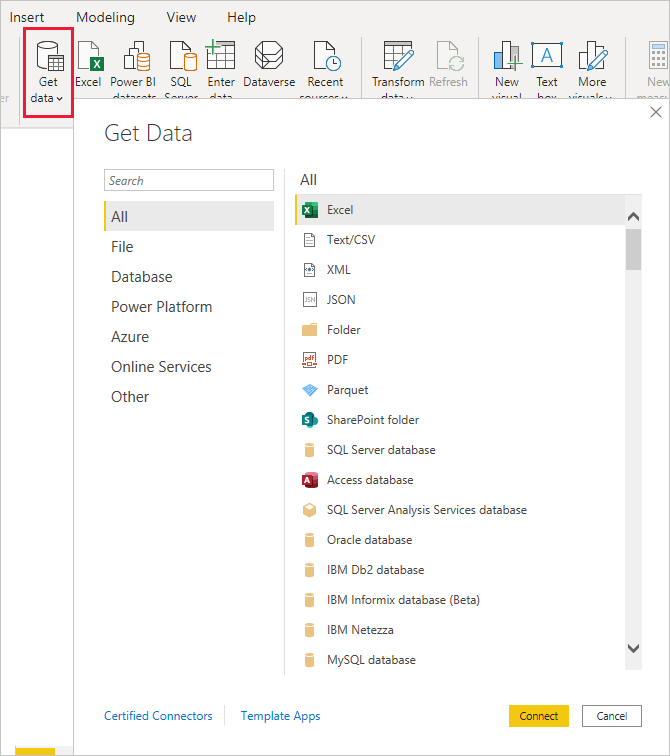
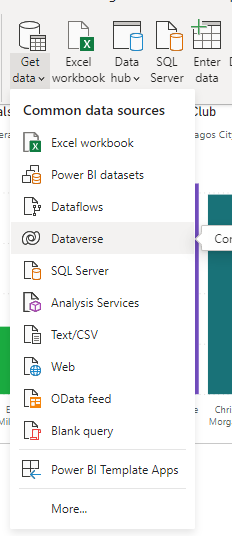
Power BI integrates with numerous data sources in the category of files spreadsheet, databases, Azure, and web sources. You can then turn this data into any kind of visualization that pleases you. You can also enter your data manually.
That chart could be a pie chart, bar chart, funnel, R and Python Visual, or even a Q & A. Power Bi is a powerful data visualization tool.
The many features you have access to with Power BI include:
- smooth integration with Microsoft products
- data refreshes
- mobile app
- map creation
- a wide variety of charts
- custom charts with R and Python
- integration with Azure machine learning
Why Use Power BI or Tableau Instead of Excel?
Tableau and Power BI are made for one important thing Excel is not primarily made for – data visualization. You can still make charts with Excel, but that functionality is limited in comparison to both Power BI and Tableau.
In addition, Tableau and Power BI are more powerful than Excel when it comes to visuals and dashboards. They also have faster processing times than Excel.
In short, companies and startups that what to be more data-driven should choose Power Bi or Tableau instead of Excel.
Differences between Tableau and Power BI
| Basis | Tableau | Power BI |
| User interface | Getting started with the Tableau UI can be intimidating at first. | The Power BI UI is relatively easy to get started with. |
| Pricing | Tableau Creator costs $70 per user/month, Tableau Explorer costs $45 user/month, and Tableau Viewer costs $15 user/month – all billed annually | Power BI Pro costs $9.99 per month, Power BI Premium per user costs $20 per month, Power BI Premium per user costs $20, and Power BI premium per capacity can cost up to $4,995 |
| Data Handling Capacity | Tableau can handle a large amount of data. Tableau cloud alone has a sttorage capacity up to 100 GB | Power BI can also handle large amounts of data. Power BI Premium can support data models up to 400 GB (compressed memory). |
| Platform | Tableau is platform-agnostic. It runs on both Mac and Windows. | There's no native version of Power BI for Mac, but there are workarounds like VM and remote viewer. |
| Enterprise | Tableau is suitable for large-scale enterprises that want to be more data-driven. | Power BI is suitable for both small-scale enterprises and large scale enterprises. |
| Data Sources | Tableau has access to a wide range of data sources - including files | Power BI aslo has a wide range of data sources based on files, databases, Azure, and online services like Google Analytics, Adobe Analytics, and many more. |
| Machine Learning Support | Tableau has built-in support for Machine Learning with Python | Power BI integrates with Azure Machine Learning. |
| Community | Tableau has a supportive community with over a million users. There's also a forum where users can get help. | Power BI is younger than Tableau in the market, but it still has a considerable number of community members. |
Final Thoughts
Both Power BI and Tableau perform well in business intelligence, so it is hard to say one is better than the other.
The only conclusion that is relatively easy to draw is that Tableau is more robust than Power BI, and that Power BI is easier to get started with and more affordable.
But if you really need to choose one, below are some metrics to consider:
- If you are on a budget, Power BI might be a better option because it has more affordable pricing
- If you want to quickly get started with Data Analytics, Power BI would make the best option for you.
- If your data professionals are more productive with Power BI, choose Power BI. And if they are more productive with Tableau, choose Tableau.
- If you have a large amount of data to process and you think the data would continue to increase, you can consider choosing Tableau or upgrade to the Enterprise version of Power BI if you're already using Power BI.
Thank you for reading.