by Sina Habibian
The Programmer’s Guide to Booking a Concert
About two months ago, a friend and I decided to organize a concert in San Francisco. We had no prior experience promoting shows, but we both loved live music and felt up to the challenge. Plus, 2016 had been a crappy year, and it seemed like this would be a good way to bring the community together and end the year on a positive note.
We began by reaching out to local acts we personally knew with hopes of booking them for a concert in December. A week later, we had exhausted our list of contacts and still had no success. I began thinking about whether we could analyze social media to scout local musicians.
I decided to look into Soundcloud, the de facto online hangout for musicians. Having met a few musicians through another project, I knew they routinely used the platform to distribute music and connect with fans. It didn’t matter who or where someone was — a bedroom DJ in SoMa, a garage band in Mountain View, or a singer-songwriter in Oakland — they all posted music on Soundcloud. And as long as they had posted a single track, I knew I would be able to find them.
Crawling the Soundcloud Graph
A quick look at Soundcloud’s Search API revealed that it wouldn’t be adequate. The simple keyword search would not allow me to write a query like “return any user based in San Francisco or Oakland who has less than 10k followers and has posted at least one track”.
Looking for a solution, I realized that crawling the social graph could be an effective approach. I could write an algorithm which, when seeded with a Soundcloud user, would pull all their followers and followings, and then in turn pull all followers and followings for each of those users. This simple recursive algorithm would expand to cover thousands of users after a few iterations. I would then have the luxury to analyze the social connections any which way, the easiest of which would be writing a SQL query.
I picked Afrolicious, Mark Slee, EARMILK and a few others as seed accounts. These users are deeply integrated into the hip hop, electronic, and indie scenes of San Francisco. I was confident that their combined social graph would provide a diverse and complete representation of Bay Area music.
As I began experimenting with the algorithm, I realized that it was impractical to pull a user’s followers. Musicians regularly have tens or hundreds of thousands of followers (Calvin Harris at the extreme end of the spectrum has 7.08m followers). Pulling all followers for all users was obviously a sub-optimal approach. I also didn’t intend on paying a thousand dollars a month in database costs.
The solution was to crawl only the followings and not the followers. Musicians follow other musicians. Interestingly enough, there are even papers that have analyzed this behavior and the “virtual scenes” that emerge (Allington et al., 2015). By crawling the following graph, I could efficiently map out the local music scene. Furthermore, by keeping track of who follows who, I could later use an algorithm like PageRank to find up-and-comers who do not yet have many followers but nevertheless have a vote of confidence from the community.
I built a Sinatra app to crawl the Soundcloud social graph and saved all users and their relationships to a Postgres database. After a few iterations, there were over 200k users and 500k relationships. It was time to make sense of the data.
Analyzing the Network
I wrote a Python script to query the database for any Soundcloud user with at least 500 followers, at least one track, and based in San Francisco or Oakland. I then mapped out these users and their relationships onto a Networkx directed graph. It was then simple to export a .gexf graph file which could be consumed by Gephi for visual analysis.
Gephi turned out to be an incredible tool for visualizing social networks and gave me more than enough to play with.
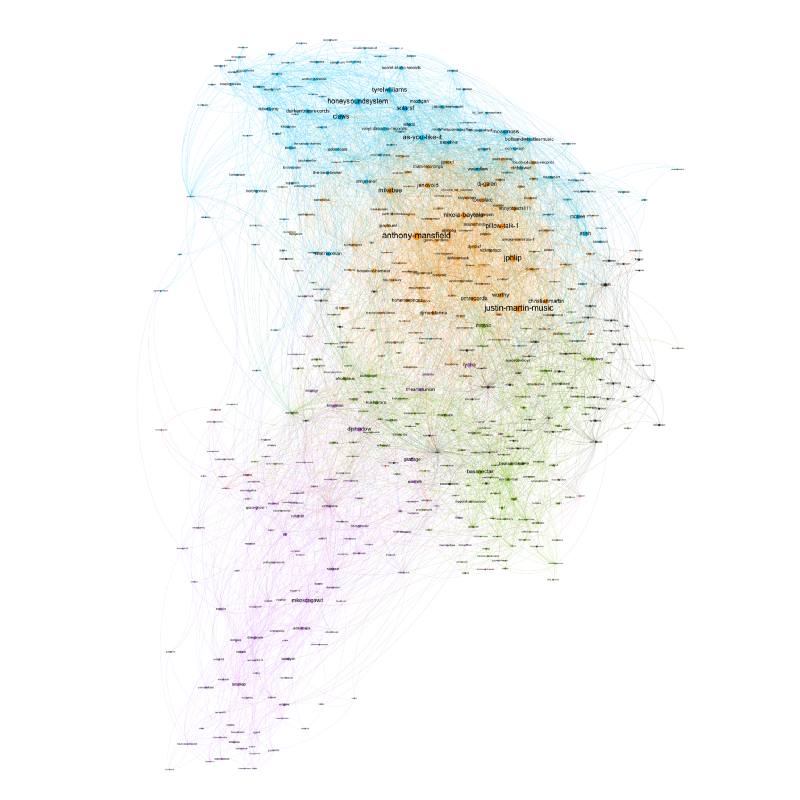
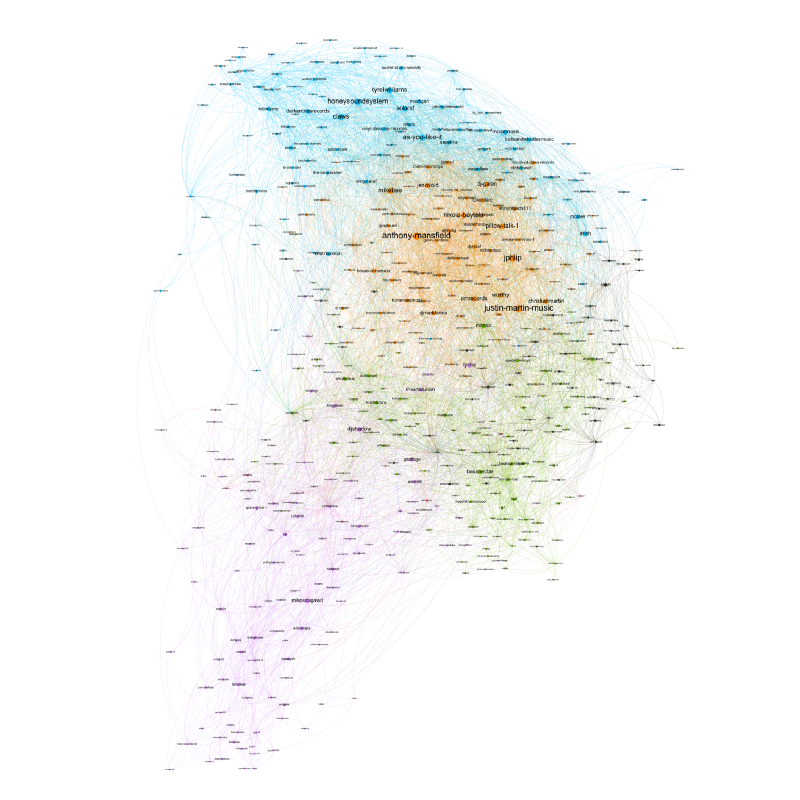
The above is a force-directed graph of the Soundcloud network. I first used PageRank to leverage the existing follower-following relationships and determine which the most important nodes are. This is represented as the size of a node. I then layered on a built-in modularity optimization algorithm to detect communities. The community is represented as the color of a node.
This graph provides an interesting viewpoint into the San Francisco music scene. The largest node, Anthony Mansfield, is a veteran Bay Area House DJ who is also deeply involved with the Disco Knights Burning Man camp. Another large node is Honey Sound System, a DJ collective who calls San Francisco home. The bottom-left of the graph is a Hip Hop cluster including San Francisco artists like Telli Prego and Show Banga.
Our goal was to find musicians for our upcoming concert. Ironically, this was now tough given the quantity of available options. We had identified over a thousand Soundcloud accounts as musicians in the Bay Area. We did not have a good way of listening to this amount of music short of copying each Soundcloud URL into the browser. Furthermore, we wanted input from our friends and community on who they liked to see live.
Scouting Talent
To address these issues, I added a UI layer to the Sinatra app so that we could streamline our scouting efforts. It showed a list of musicians ranked according to the results of the earlier network analysis. There was an embedded Soundcloud widget so that we could listen to an artist’s music without leaving the page. I also added a rating system so that we could assess each artist and comment on whether we wanted to see them live.
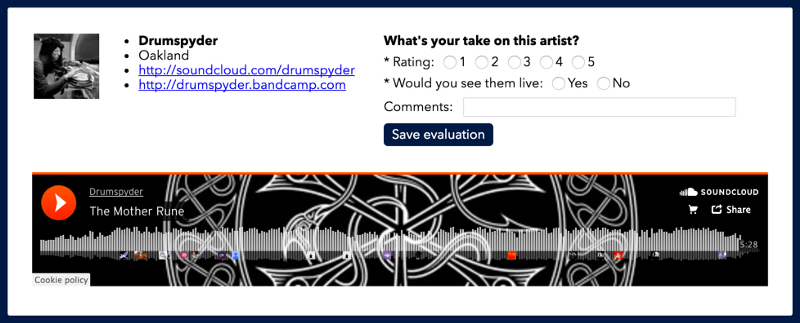
I then layered on a user authentication scheme so that multiple people could use the system at once. We enlisted the help of a few friends living in the city who also appreciate music. With their help and our newly built talent scouting system, we collectively listened to and voted on 400 artists. I then built an admin page so that I could see the best rated musicians across the platform.
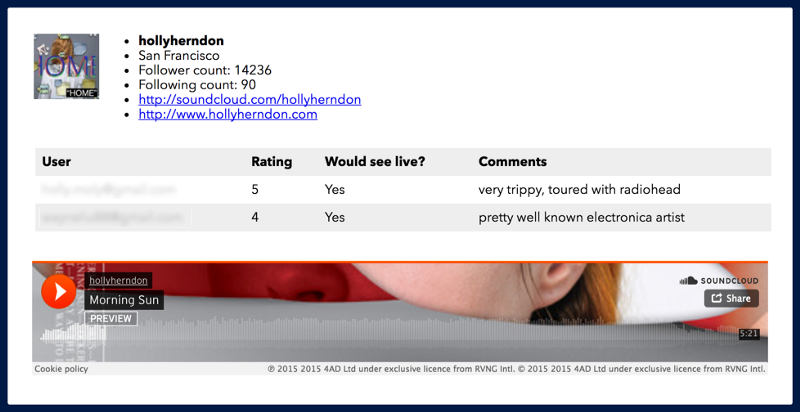
We had crowd-sourced our scouting efforts and were starting to find some gems. More importantly, we had validated demand on which local acts our friends and community wanted to see live.
Booking the Show
With things coming together, we gave ourselves a name: the Gremlins. Gremlins are cute, mischievous, and are always messing around and breaking things. This seemed fitting given our progress so far.
We reached out to a few of our favorite new artists, and booked two funky and talented local acts: Foxtails Brigade and Baby’s Day Out. We were talking with venues in parallel and landed a night at The Lost Church, a cozy theatre in The Mission with capacity for 75 people. The wooden interior and the eclectic artwork strewn about the place were inline with the atmosphere we were trying to create.
The Gremlins Present
A month later, we walked into The Lost Church on the night of the concert. I felt a sense of fulfillment as we welcomed friends and friends-to-be into the theatre. The show was sold out.
Laura from Foxtails Brigade and Meggy and Mel from Baby’s Day Out shared their music with a lively audience. We followed them through joyful and melancholic moments. It was a memorable evening.
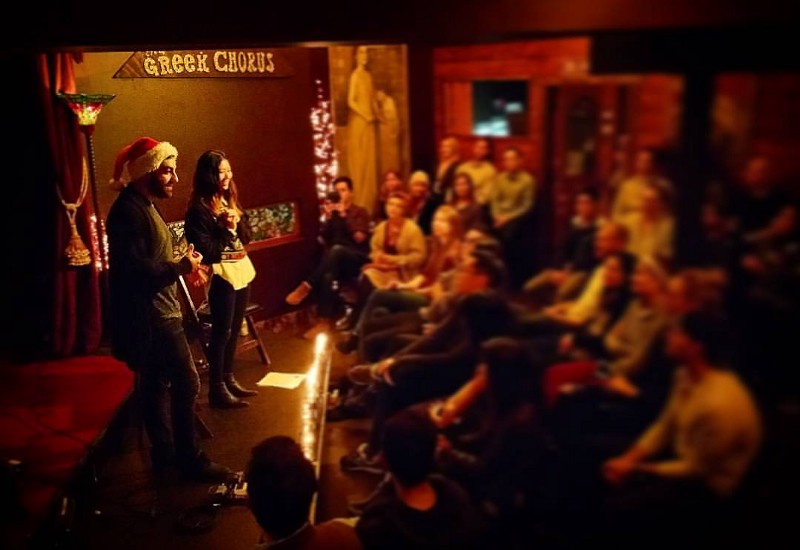
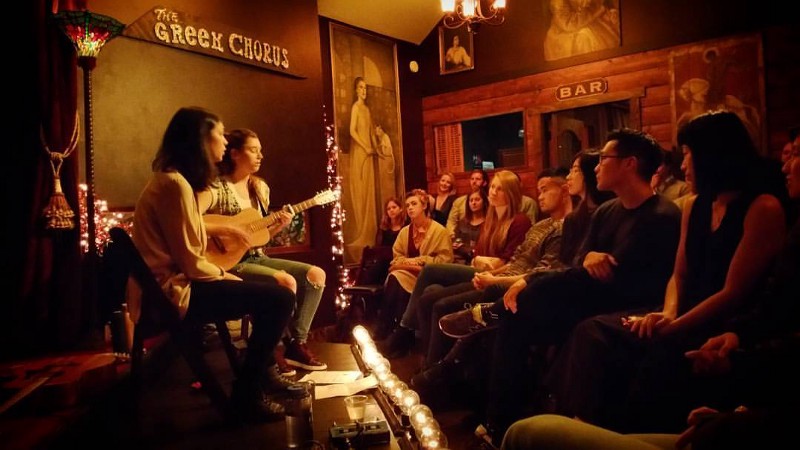
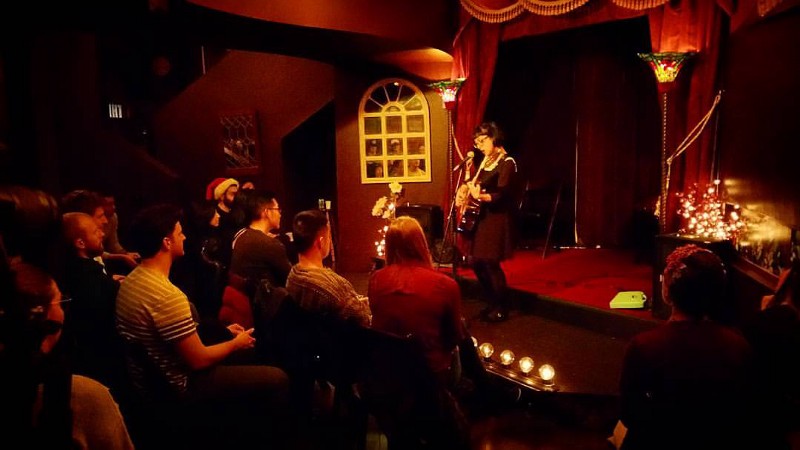
In coordinating this concert, I experienced two weirdly different perspectives on viewing a ‘musician’. First, as a node whose relative importance and degree of connectedness can be calculated in a connected network. Second, as a soulful and talented human being who can move an audience through the expression of their art.
This dichotomy is a fact of life in today’s world. We are each heavily networked within the social graphs of Facebook, Instagram, and Twitter. It’s fascinating to think of ourselves as nodes in this perspective. I wonder what insights tinkerers at these companies have gleaned about our inner lives.
