
By Adam Henson
Audit website performance manually, programmatically, or automatically

Lighthouse is an open-source project by Google that gives you a way to measure web page performance. It has configurable settings for reproducing various conditions. You can set network and device type to simulate, for example.
You give Lighthouse a URL to audit, it runs a series of audits against the page, and then it generates a report on how well the page did. From there, use the failing audits as indicators on how to improve the page. Each audit has a reference doc explaining why the audit is important, as well as how to fix it. Lighthouse
There are many reasons why you’d want to measure performance, but one of the most important is about the impact on SEO. I go into more detail about this and how to address certain metrics in this article.
Running Lighthouse with Chrome DevTools
You can run performance audits manually with the Chrome DevTools browser extension. Simply fire up the extension from the web page you’d like to test and select the “Audits” panel.
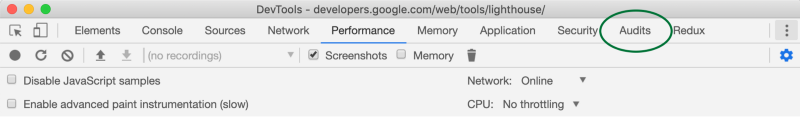
Among a variety of audits, you can choose “performance”. You can also choose to simulate device type and network throttling. Some information specifically about throttling can be found in the Lighthouse project Github repo.
Click on “Run audits” next. Upon completion, Lighthouse provides a report within the extension UI.
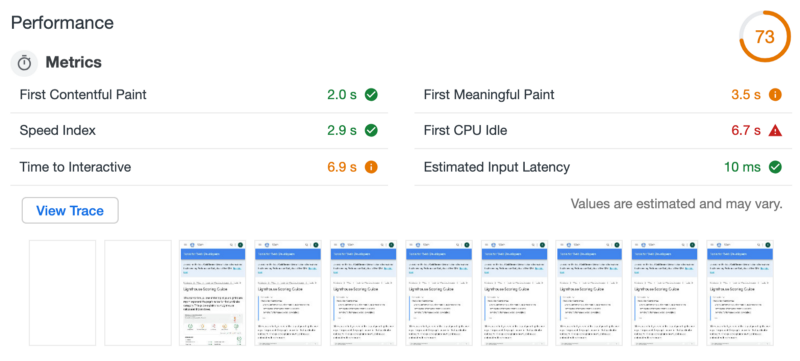
This report is a general overview of important metrics, opportunities, and overall performance score. Thumbnails illustrate the lifecycle of page load. What does this all mean? Google provides a plethora of documentation describing each metric, how to address them and the overall performance score.
In the top left side of Chrome DevTools panel is a download icon that you can use to download the full report in JSON format. You can then use it to create a PDF report via Lighthouse Report Viewer.
Due to the high volume of factors playing into the lifecycle of page load, it’s important to compare results in batches. Taking an average of 5 runs, for example, will provide better insight.
Running Lighthouse Programmatically
For our standard “run of the mill” situations, the above should suffice. Another way to run Lighthouse involves installing the open-source package via NPM and following the instructions in the CLI documentation. This can be beneficial if you want to run audits programmatically in a build pipeline, for example.
Similar to the above, you can also run Lighthouse in code by following the documentation for using the Node module programmatically. You could create a full-fledged Node.js application with Lighthouse ?!
Running Lighthouse Automatically Over Time
So now that we’re pros — let’s take this to the next level. There are many integrations listed in the Lighthouse documentation, so let’s take a look at one of them.
Using “Foo” to Run Lighthouse and Compare Results Over Time
In an engineering setting where many developers are deploying application changes on a regular basis, it can be important to monitor website performance over time to associate change sets with performance degradation or improvement. Another example would be teams that have initiatives to improve performance for SEO ranking or other reasons. In these situations, it’s critical to monitor website performance over days, weeks, months, etc.
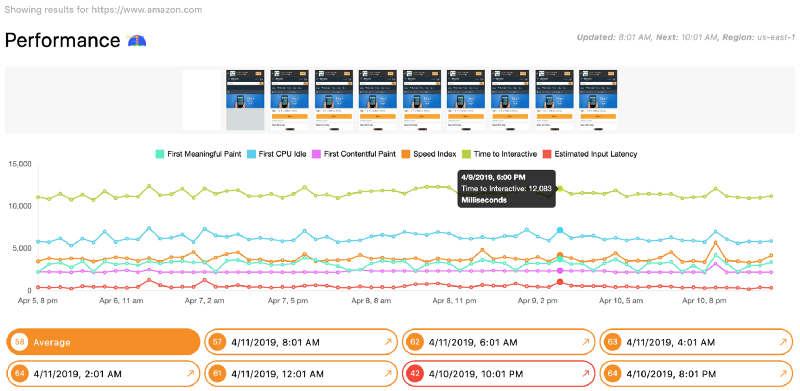
You can add URLs to track at www.foo.software and monitor performance change. Foo also provides email, Slack or PagerDuty notifications when performance has dropped below a threshold defined by the user, when it’s back to normal, and when improvements are identified automatically!
The best part about it is that you can create an account for free! Once registered and logged in, click the “Pages” link from the top navigation. This is where you can add URLs to monitor. Foo saves results and displays a timeline chart providing a visualization of important metrics. You can toggle through days, weeks, months and drill into detailed reports.
Conclusion
Lighthouse is becoming an industry standard in website performance measurement. There are books worth documentation about Lighthouse that provides details of important metrics.