
By Jerin Paul
How much prominence do customers hold in your business layout? Well, this was a rhetorical question. We all know that the majority of businesses thrive only because of their customers. Therefore it is imperative that you understand your customers well before serving them. Knowing your customers helps you provide tailored services. This results in enhanced customer engagement and increased sales.

Do you know your customers? Well, this question is very vague. If you are not able to answer this with certain qualitative aspects of your customers, then you need to get to work now. I am sure that all business owners have an image of their ideal customer in their minds, regardless of how obscure it may be. Often this image is fabricated from intuition. It may not be supported by any tautological evidence.
Data never lies. It is nothing more than a collection of facts and figures, and at times it can show us a mirror. This article will explain how to use the “magic” of data science to gain a coherent understanding of your customers. Precisely, we will learn how to apply a clustering algorithm to this mall customer dataset. We will then draw inferences from the output to gain a better understanding of the customers that frequent the mall. Thank you for bearing with such a lengthy prelude, and you get the project source code for your patience.
What is customer bucketing?
Customer segmentation or customer bucketing is the practice of dividing a company’s customers into groups (a.k.a. buckets) that reflect similarity among customers in each group. The goal of segmenting customers is to decide how to relate to customers in each segment in order to maximize the value of each customer to the business.
Bucketing customers enables you to cater to each customer group in a way that can maximise your sales. For marketers, segmenting your target customers allows you to shape your communications in a way that causes maximum impact.
In this project, we will use cluster analysis to segment customers into clusters based on their annual income. For this, we will use Kmeans, which is one of the finest clustering algorithms out there. K-means clustering is an unsupervised learning algorithm which finds groups in data. The number of groups is represented by the letter K.
Let’s get started.
Please feel free to follow along. The dataset can be downloaded here.
Peeking at the Data.
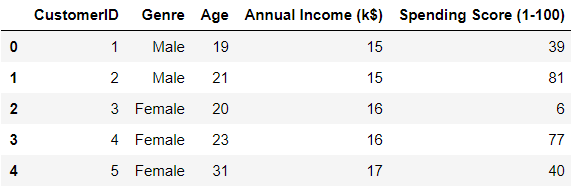
The mall customer dataset is a relatively small dataset as it contains only 199 rows and 5 columns. If you glance at the picture below this paragraph, then you will notice that these five columns titles are CustomerID, Genre, Age, Annual Income (k$), and Spending Score (1–100).
We will get started by importing the necessary libraries.
import pandas as pd
import numpy as np
from sklearn.cluster import KMeans

import matplotlib.pyplot as plt
plt.rc(“font”, size=14)
Now, we will import the dataset.
data_path = "Mall_Customers.csv"
df = pd.read_csv(data_path)
Maybe it’s just me, but I find a few column headers unsettling for some reason. Let’s dive in and change those.
df.rename(columns={'Genre':'Gender',
                   'Annual Income (k$)':'Annual_Income',
                   'Spending Score (1-100)':'Spending_Score'
                  },
                   inplace=True
          )
In this project, we will be clustering the customers using their annual income and their spending score (between 1 and 100). Therefore we will only be using those two columns.
X = df.iloc[:, [3, 4]].values
Now that we are all set on the data front, it is time to start with our clustering. Before we run our clustering algorithm, it is imperative to determine the number of clusters to divide our customers into. There are a few different methods of determining the ideal number of clusters for this dataset. For that, we will be using the elbow method.
Elbow method
One method to figure out the number of clusters is by using the elbow method. This method involves running the K-means clustering algorithm on the data for different values of K and calculating the Sum of Squared Errors (S.S.E.) for each value of K.
Then, these values are plotted on a graph, and we can see that S.S.E. tends to decrease as the value of K increases. S.S.E. becomes 0 when the values of K is equal to the number of data points, because then each data point is its own cluster. Our aim is to find a point with a small value of K and that has a low S.S.E.
In this experiment, we will run K-means for different values of K in the range of 0 to 10 and store the S.S.E. in a list called distortions.
distortions = []
K = range(1, 10)
for k in K:
    kmeansModel = KMeans(n_clusters = k, init = 'k-means++',    random_state = 23)
    kmeansModel.fit(X)
    distortions.append(kmeansModel.inertia_)

plt.plot(K, distortions)
plt.title("The Elbow Method")
plt.xlabel("Number of Clusters")
plt.ylabel("S.S.E.")
plt.show()
Now, let us have a look at the graph.
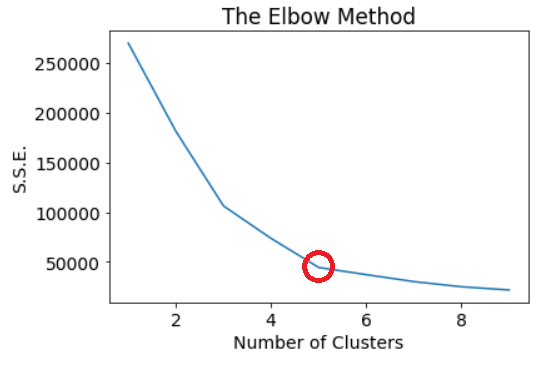
In this graph, you can observe that the S.S.E. steeply drops after every iteration of K. You can also observe that after K reaches 5, it is one downhill slope from there. So, 5 seems to be an optimum value for K, and this means that we will be dividing the customers into 5 clusters.
Now that we have figured out the number of clusters we can go ahead and create these clusters.
kmeansModel = KMeans(n_clusters = 5, init = 'k-means++', random_state = 23)
Y = kmeansModel.fit_predict(X)
Since the dataset was small, all these processes take no time to finish. Once the clusters are created, we can plot them on a graph. Each cluster point is marked using a different sign, and the centroids of each cluster are marked using solid red dots.
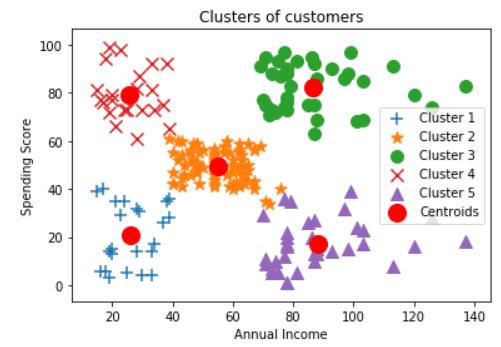
Just looking at the graph tells us about the five different types of customers that frequent the mall. If we were to name them, then they could be named as follows:
i. Low income, High spenders (Red).
ii. Low income, Low Spenders (Blue).
iii. Average income, average expenditure(Orange).
iv. High income, High spenders, and(Green)
v. High income, Low spenders(Purple).
Members of each of these groups would have more features common with each other, and therefore we have a homogeneous group. People of each of these clusters may have similar needs and desires. By keeping that in mind all marketing /sales activities can accommodate these needs and desires to attract more such customers. For example, a weekly discount sale that caters to the low-income group or reward points for purchases which will cater to the high spenders, turning them into regular customers. The possibilities are limitless and are only bounded by our imagination.
Conclusion
Understanding a business’s customer base is of utmost importance. One of the ways to gain deeper insight into customer behaviour is by segmenting them into different buckets based on their behaviour (income and expenditure in this experiment.) Similar people tend to behave similarly, and this is the crux of customer segmentation. Therefore, by planning all the sales and marketing activities around these buckets, it would promise a higher return on investment and enjoyable customer experience.