

Outliers are an important part of a dataset. They can hold useful information about your data.
Outliers can give helpful insights into the data you're studying, and they can have an effect on statistical results. This can potentially help you disover inconsistencies and detect any errors in your statistical processes.
So, knowing how to find outliers in a dataset will help you better understand your data.
There are a few different ways to find outliers in statistics.
This article will explain how to detect numeric outliers by calculating the interquartile range.
I give an example of a very simple dataset and how to calculate the interquartile range, so you can follow along if you want.
Let's get started!
What is an Outlier in Statistics? A Definition
In simple terms, an outlier is an extremely high or extremely low data point relative to the nearest data point and the rest of the neighboring co-existing values in a data graph or dataset you're working with.
Outliers are extreme values that stand out greatly from the overall pattern of values in a dataset or graph.
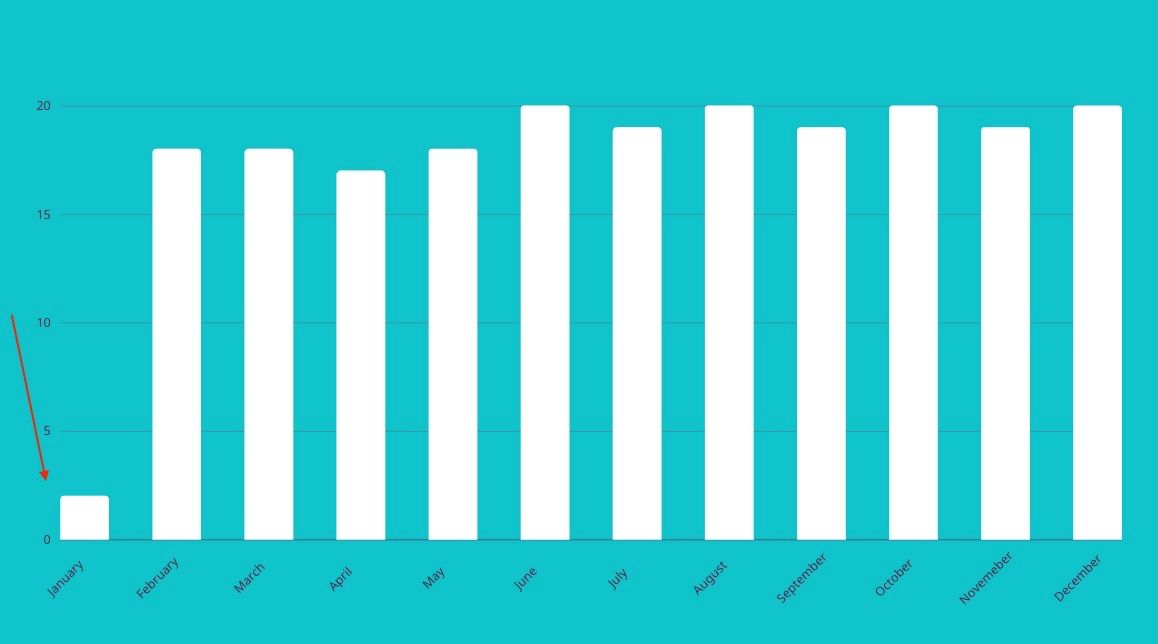
Below, on the far left of the graph, there is an outlier.
The value in the month of January is significantly less than in the other months.
How to Identify an Outlier in a Dataset
Alright, how do you go about finding outliers?
An outlier has to satisfy either of the following two conditions:
outlier < Q1 - 1.5(IQR)
outlier > Q3 + 1.5(IQR)
The rule for a low outlier is that a data point in a dataset has to be less than Q1 - 1.5xIQR.
This means that a data point needs to fall more than 1.5 times the Interquartile range below the first quartile to be considered a low outlier.
The rule for a high outlier is that if any data point in a dataset is more than Q3 - 1.5xIQR, it's a high outlier.
More specifically, the data point needs to fall more than 1.5 times the Interquartile range above the third quartile to be considered a high outlier.
As you can see, there are certain individual values you need to calculate first in a dataset, such as the IQR. But to find the IQR, you need to find the so called first and third quartiles which are Q1 and Q3 respectively.
So, let's see what each of those does and break down how to find their values in both an odd and an even dataset.
How to Find the Upper and Lower Quartiles in an Odd Dataset
To get started, let's say that you have this dataset:
25,14,6,5,5,30,11,11,13,4,2
The first step is to sort the values in ascending numerical order,from smallest to largest number.
2,4,5,5,6,11,11,13,14,25,30
The lowest value (MIN) is 2 and the highest (MAX) is 30.
How to calculate Q2 in an odd dataset
The next step is to find the median or quartile 2 (Q2).
This particular set of data has an odd number of values, with a total of 11 scores all together.
To find the median in a dataset means that you're finding the middle value – the single middle number in the set.
In odd datasets, there in only one middle number.
Since there are 11 values in total, an easy way to do this is to split the set in two equal parts with each side containing 5 values.
The median value will have 5 values on one side and 5 values on the other.
(2,4,5,5,6), 11 ,(11,13,14,25,30)
The median is 11 as it is the number that separates the first half from the second half.
An alternative way to double check if you're right is to do this:
(total_number_of_scores + 1) / 2.
This is (11 + 1) /2 = 6, which means you want the number in the 6th place of this set of data – which is 11.
So Q2 = 11.
How to calculate Q1 in an odd dataset
Next, to find the lower quartile, Q1, we need to find the median of the first half of the dataset, which is on the left hand side.
As a reminder, the initial dataset is:
(2,4,5,5,6), 11 ,(11,13,14,25,30)
The first half of the dataset, or the lower half, does not include the median:
2,4,5,5,6
This time, there is again an odd set of scores – specifically there are 5 values.
You want to again split this half set into another half, with an equal number of two values on each side. You'll get a unique number, which will be the number in the middle of the 5 values.
Pick the middle value that stands out:
(2,4),5,(5,6)
In this case it's Q1 = 5.
To double check, you can also do total_number_of_values + 1 / 2, similar to the previous example:
(5 + 1) /2 = 3.
This means you want the number in the 3rd place, which is 5.
How to calculate Q3 in an odd dataset
To find the upper quartile, Q3, the process is the same as for Q1 above. But in this case you take the second half on the right hand side of the dataset, above the median and without the median itself included:
(2,4,5,5,6), 11 ,(11,13,14,25,30)
11,13,14,25,30
You split this half of the odd set of numbers into another half to find the median and subsequently the value of Q3.
You again want the number in the 3rd place like you did for the first half.
(11,13),14,(25,30)
So Q3 = 14.
How to calculate IQR in an odd dataset
Now, the next step is to calculate the IQR which stands for Interquartile Range.
This is the difference/distance between the lower quartile (Q1) and the upper quartile (Q3) you calculated above.
As a reminder, the formula to do so is the following:
IQR = Q3 - Q1
To find the IQR of the dataset from above:
IQR= 14 - 5
IQR = 9
How to find an outlier in an odd dataset
To recap so far, the dataset is the one below:
2,4,5,5,6,11,11,13,14,25,30
and so far, you have calucalted the five number summary:
MIN = 2
Q1 = 5
MED = 11
Q3 = 14
MAX = 30
Finally, let's find out if there are any outliers in the dataset.
As a reminder, an outlier must fit the following criteria:
outlier < Q1 - 1.5(IQR)
Or
outlier > Q3 + 1.5(IQR)
To see if there is a lowest value outlier, you need to calculate the first part and see if there is a number in the set that satisfies the condition.
Outlier < Q1 - 1.5(IQR)
Outlier < 5 - 1.5(9)
Outlier < 5 - 13.5
outlier < - 8.5
There are no lower outliers, since there isn't a number less than -8.5 in the dataset.
Next, to see if there are any higher outliers:
Outlier > Q3  + 1.5(IQR)=
Outlier > 14 + 1.5(9)
Outlier > 14 + 13.5
Outlier > 27,5
And there is a number in the dataset that is more than 27,5:
2,4,5,5,6,11,11,13,14,25,30
In this case, 30 is the outlier in the existing dataset.
How to Find the Upper and Lower Quartiles in an Even Dataset
What happens when you have a dataset that consists of an even set of data?
There isn't just one stand-out median (Q2), nor is there a standout upper quartile (Q1) or standout lower quartile (Q3).
So the process of calculating quartiles and then finding an outlier is a bit different.
How to calculate Q2 in an even dataset
Say that you have this dataset with 8 numbers:
10,15,20,26,28,30,35,40
This time, the numbers are already sorted from lowest to highest value.
To find the median number in an even dataset, you need to find the value that would be in between the two numbers that are in the middle. You add them together and divide them by 2, like so:
10,15,20,26,28,30,35,40
26 + 28 = 54
54 / 2 = 27
How to calculate Q1 in an even dataset
To calculate to upper and lower quartiles in an even dataset, you keep all the numbers in the dataset (as opposed to in the odd set you removed the median).
This time, the dataset is cut in half.
10,15,20,26 | 28,30,35,40
To find Q1, you split the first half of the dataset into another half which leaves you with a remaining even set:
10,15 | 20,26
To find the median of this half, you take the two numbers in the middle and divide them by two:
Q1 = (15 + 20)/2
Q1 =  35 / 2
Q1 = 17,5
How to calculate Q3 in an even dataset
To find Q3, you need to focus on the second half of the dataset and split that half into another half:
28,30,35,40 -> 28,30 | 35,40
The two numbers in the middle are 30 and 35.
You add them and divide them by two, and the result is:
Q3 = (30 + 35)/2
Q3 =  65 / 2
Q3 = 32,5
How to calculate the IQR in an even dataset
The formula for calculating IQR is exactly the same as the one we used to calculate it for the odd dataset.
IQR = Q3 - Q1
IQR = 32,5 - 17,5
IQR = 15
How to find an outlier in an even dataset
As a recap, so far the five number summary is the following:
MIN = 10
Q1 = 17,5
MED = 27
Q3 = 32,5
MAX = 40
To calculate any outliers in the dataset:
outlier < Q1 - 1.5(IQR)
Or
outlier > Q3 + 1.5(IQR)
To find any lower outliers, you calcualte Q1 - 1.5(IQR) and see if there are any values less than the result.
outlier < 17,5 - 1.5(15)=
outlier < 17,5 - 22,5
outlier < -5
There aren't any values in the dataset that are less than -5.
Finally, to find any higher outliers, you calculate Q3 - 1.5(IQR) and see if there are any values in the dataset that are higher than the result
outlier > 32.5 + 1.5(15)=
outlier > 32.5 + 22.5
outlier > 55
There aren't any values higher than 55 so this dataset doesn't have any outliers.
Conclusion
In this article you learned how to find the interquartile range in a dataset and in that way calculate any outliers.
If you are interested in learning more about Statistics and the basics of Data Science, check out this free 8hour University course on freeCodeCamp's YouTube channel.
Thank you for for reading and happy learning.