
By Peter Gleeson
P values are one of the most widely used concepts in statistical analysis. They are used by researchers, analysts and statisticians to draw insights from data and make informed decisions.
Along with statistical significance, they are also one of the most widely misused and misunderstood concepts in statistical analysis.
This article will explain:
- how a P value is used for inferring statistical significance
- how P values are calculated
- and how to avoid some common misconceptions
Recap: Hypothesis testing
Hypothesis testing is a standard approach to drawing insights from data. It is used in virtually every quantitative discipline, and has a rich history going back over one hundred years.
The usual approach to hypothesis testing is to define a question in terms of the variables you are interested in. Then, you can form two opposing hypotheses to answer it.
- The null hypothesis claims there is no statistically significant relationship between the variables
- The alternative hypothesis claims there is a statistically significant relationship between the variables
For example, say you are testing whether caffeine affects programming productivity. There are two variables you are interested in - the dose of the caffeine, and the productivity of group of software developers.
The null hypothesis would be:
- "Caffeine intake has no significant effect on programming productivity".
The alternative hypothesis would be:
- "Caffeine intake does have a significant effect on productivity".
The word 'significant' has a very specific meaning here. It refers to a relationship between variables existing due to something more than chance alone.
Instead, the relationship exists (at least in part) due to 'real' differences or effects between the variables.
The next step is to collect some data to test the hypotheses. This could be collected from an experiment or survey, or from a set of data you have access to.
The final step is to calculate a test statistic from the data. This is a single number that represents some characteristic of your data. Examples include the t-test, Chi-squared test, and the Kruskal-Wallis test - among many others.
Exactly which one to calculate will depend on the question you are asking, the structure of your data, and the distribution of your data.
Here's a handy cheatsheet for your reference.
In the caffeine example, a suitable test might be a two-sample t-test.
You will end up with a single test statistic from your data. All that is left to do is interpret this result to determine whether it supports or rejects the null hypothesis.
This is where P values come into play.
How unlikely is this statistic?
Recall that you have calculated a test statistic, which represents some characteristic of your data. You want to understand whether it supports or rejects the null hypothesis.
The approach taken is to assume the null hypothesis is true. That is, assume there are no significant relationships between the variables you are interested in.
Then, look at the data you have collected. How likely would your test statistic be if the null hypothesis really is true?
Let's refer back to the caffeine intake example from before.
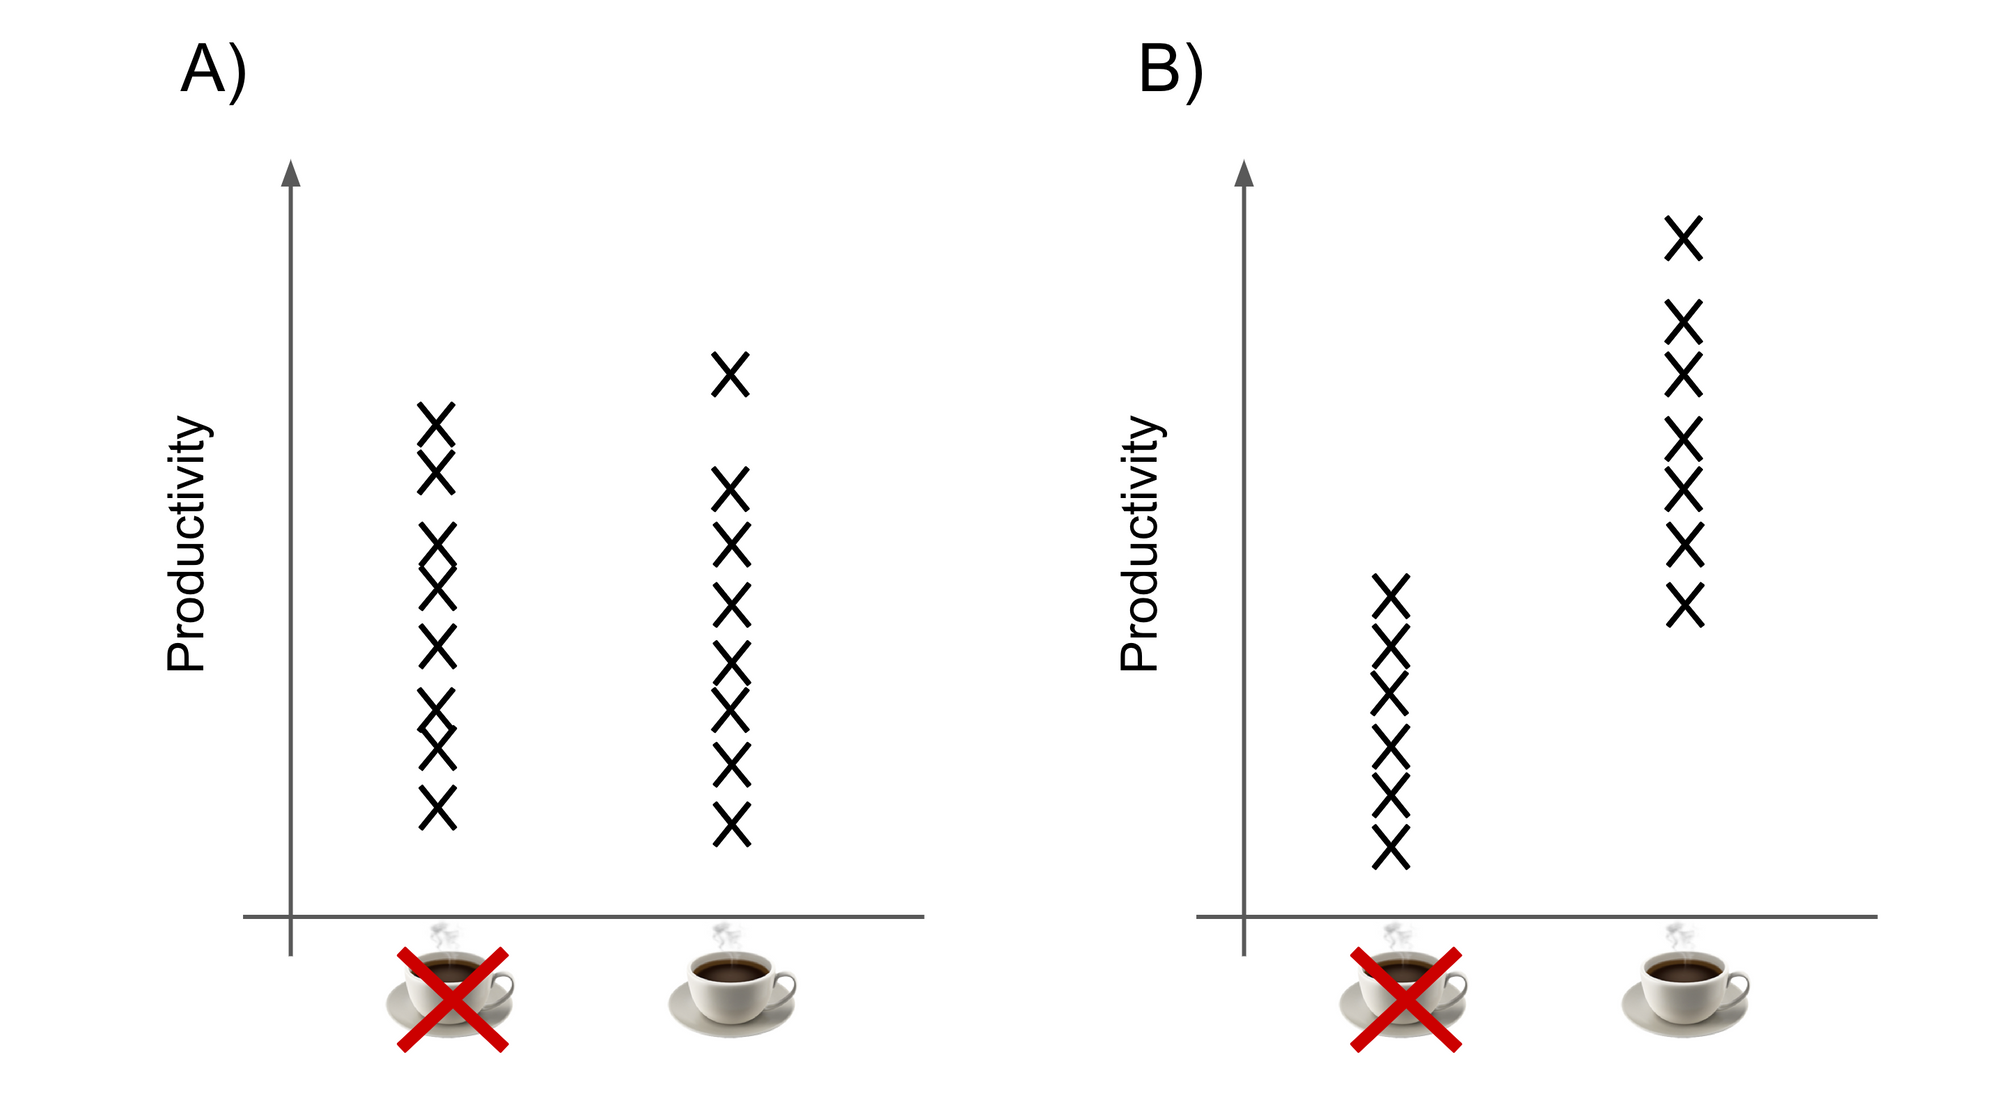
- Say that productivity levels were split about evenly between developers, regardless of whether they drank caffeine or not (graph A). This result would be likely to occur by chance if the null hypothesis were true.
- However, suppose that almost all of the highest productivity was seen in developers who drank caffeine (graph B). This is a more 'extreme' result, and would be unlikely to occur just by chance if the null hypothesis were true.
But how 'extreme' does a result need to be before it is considered too unlikely to support the null hypothesis?
This is what a P value lets you estimate. It provides a numerical answer to the question: "if the null hypothesis is true, what is the probability of a result this extreme or more extreme?"
P values are probabilities, so they are always between 0 and 1.
- A high P value indicates the observed results are likely to occur by chance under the null hypothesis.
- A low P value indicates that the results are less likely to occur by chance under the null hypothesis.
Usually, a threshold is chosen to determine statistical significance. This threshold is often denoted α.
If the P value is below the threshold, your results are 'statistically significant'. This means you can reject the null hypothesis (and accept the alternative hypothesis).
There is no one-size-fits-all threshold suitable for all applications. Usually, an arbitrary threshold will be used that is appropriate for the context.
For example, in fields such as ecology and evolution, it is difficult to control experimental conditions because many factors can affect the outcome. It can also be difficult to collect very large sample sizes. In these fields, a threshold of 0.05 will often be used.
In other contexts such as physics and engineering, a threshold of 0.01 or even lower will be more appropriate.
Chi-squared example
In this example, there are two (fictional) variables: region, and political party membership. It uses the Chi-squared test to see if there's a relationship between region and political party membership.
You can change the number of members for each party.
- Null hypothesis: "there is no significant relationship between region and political party membership"
- Alternative hypothesis: "there is a significant relationship between region and political party membership"
Hit the "rerun" button to try different scenarios.
Common misconceptions and how to avoid them
There are several mistakes that even experienced practitioners often make about the use of P values and hypothesis testing. This section will aim to clear those up.
❌The null hypothesis is uninteresting - if the data is good and analysis is done right, then it is a valid conclusion in its own right.
✅A question worth answering should have an interesting answer - whatever the outcome.
❌P value is the probability of the null hypothesis being true - a P value represents "the probability of the results, given the null hypothesis being true". This is not the same as "the probability of the null hypothesis being true, given the results".
P(Data | Hypothesis) ≠ P(Hypothesis | Data)
✅This means a low P value tells you: "if the null hypothesis is true, these results are unlikely". It does not tell you: "if these results are true, the null hypothesis is unlikely".
❌You can use the same significance threshold for multiple comparisons - remember the definition of the P value. It is the probability of observing a certain test statistic by chance alone.
If you use a threshold of α = 0.05 (or 1-in-20) and you carry out, say, 20 stats tests... you might expect by chance alone to find a low P value.
✅You should use a lower threshold if you are carrying out multiple comparisons. There are correction methods that will let you calculate how much lower the threshold should be.
❌The significance threshold means anything at all - it is entirely arbitrary. 0.05 is just a convention. The difference between p = 0.049 and p = 0.051 is the pretty much the same as between p = 0.039 and p = 0.041.
This is one of the biggest weaknesses of hypothesis testing this way. It forces you to draw a line in the sand, even though no line can easily be drawn.
✅Therefore, always consider significance thresholds for what they are - totally arbitrary.
❌Statistical significance means chance plays no part - far from it. Often, there are many causes for a given outcome. Some will be random, others less so.
✅Finding one non-random cause doesn't mean it explains all the differences between your variables. It is important not to mistake statistical significance with "effect size".
❌P values are the only way to determine statistical significance - there are other approaches which are sometimes better.
✅As well as classical hypothesis testing, consider other approaches - such as using Bayes factors, or False Positive Risk instead.