

Matplotlib is a Python library used for data visualization, and creating interactive plots and graphs.
In this article, you'll learn how to add colors to your Matplotlib plots using parameter values provided by the Matplotlib plot() function.
You'll learn how to change the color of a plot using:
- Color names.
- Color abbreviations.
- RGB/RGBA values.
- Hex values.
Let's get started!
How To Change Line Color in Matplotlib
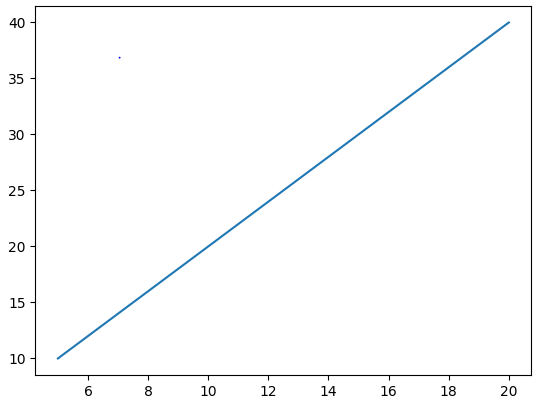
By default, the color of plots in Matplotlib is blue. That is:
import matplotlib.pyplot as plt

x = [5,10,15,20]
y = [10,20,30,40]

plt.plot(x,y)
plt.show()
To change the color of a plot, simply add a color parameter to the plot function and specify the value of the color.
Here are some examples:
How To Change Line Color in Matplotlib Example #1
In this example, we'll change the color of the plot using a color name.
import matplotlib.pyplot as plt

x = [5,10,15,20]
y = [10,20,30,40]

plt.plot(x,y, color='red')
plt.show()
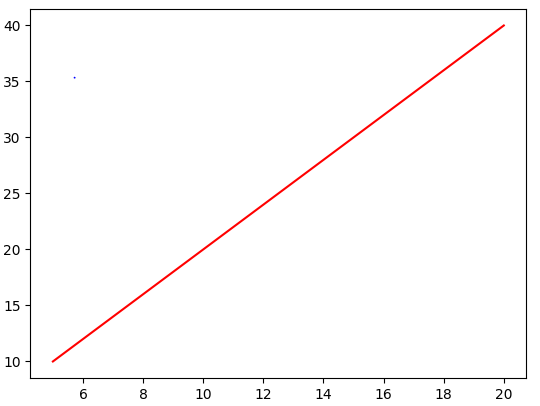
In the example above, we assigned a value of 'red' to the color parameter: color='red'.
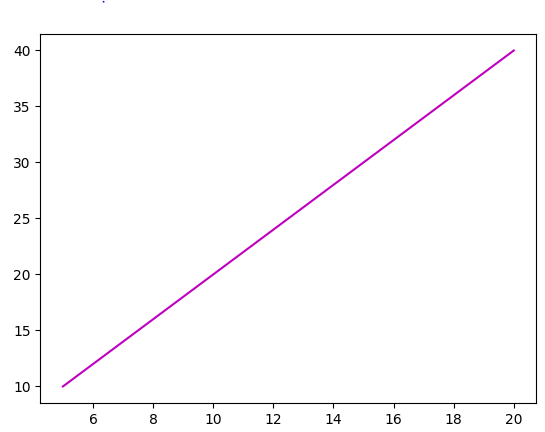
How To Change Line Color in Matplotlib Example #2
You can make use of abbreviations when specifying the color to be used for the plot. That is:
'b'= blue'g'= green'r'= red'c'= cyan'm'= magenta'y'= yellow'k'= black'w'= white
Here's a code example:
import matplotlib.pyplot as plt

x = [5,10,15,20]
y = [10,20,30,40]

plt.plot(x,y, color='m')
plt.show()
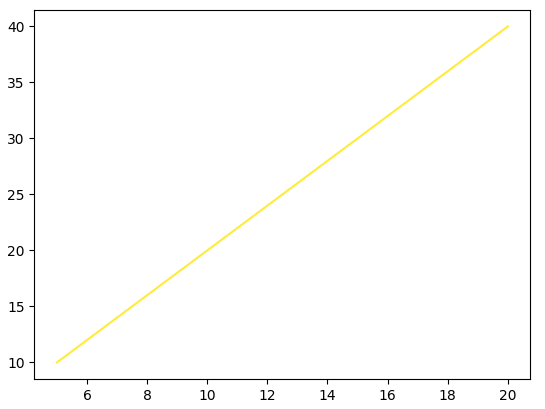
How To Change Line Color in Matplotlib Example #3
You can also make use of RGB and RGBA (red, green, blue, alpha), and hex values.
Here's an example that creates a plot with a yellow color using RGB:
import matplotlib.pyplot as plt

x = [5,10,15,20]
y = [10,20,30,40]

plt.plot(x,y, color=(1.0, 0.92, 0.23))
plt.show()
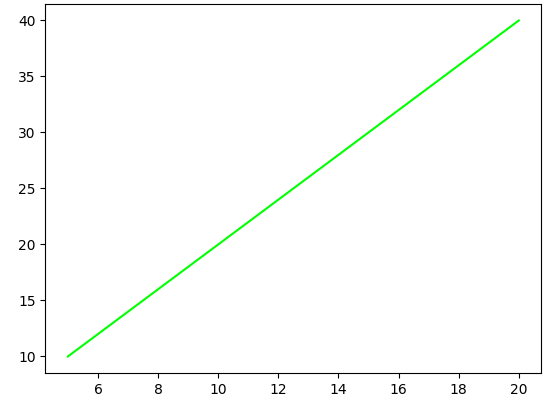
Here's another example that uses a hex value to create a green plot:
import matplotlib.pyplot as plt

x = [5,10,15,20]
y = [10,20,30,40]

plt.plot(x,y, color='#00FF00')
plt.show()
Summary
In this article, we talked about how to change the color of plots in Matplotlip.
We saw examples that showed how to use color name, abbreviations, RGB/RGBA values, and hex values to change the color of a plot in Matplotlib.
Happy coding!