
The Coronavirus (COVID-19) pandemic has swiftly changed how all of us interact day to day. How can we use available APIs to build a mapping app that shows the impact it has had on the world?
Update: The original NovelCOVID API v1 endpoint has been deprecated. Please update and use the following instead: https://corona.lmao.ninja/v2/countries
Author’s Note: This is meant to be a demo and proof of concept for putting together an impactful mapping application using real life data. For complete and accurate analysis, please make sure to use tools like Johns Hopkins University dashboard. Stay home and be safe! ❤️
- What are we going to build?
- What do we need before we get started?
- Step 1: Cleaning up some unneeded code
- Step 2: Fetching the Coronavirus data
- Step 3: Transform the Coronavirus data into a geographic data format
- Step 4: Adding the Coronavirus data to the map
- What else can we do?
- Be safe and stay informed
- Want to learn more about maps?
What are we going to build?
We’ll be putting together a mapping application that uses an API containing recent Coronavirus statistics and maps out the locations and impact each country is facing.
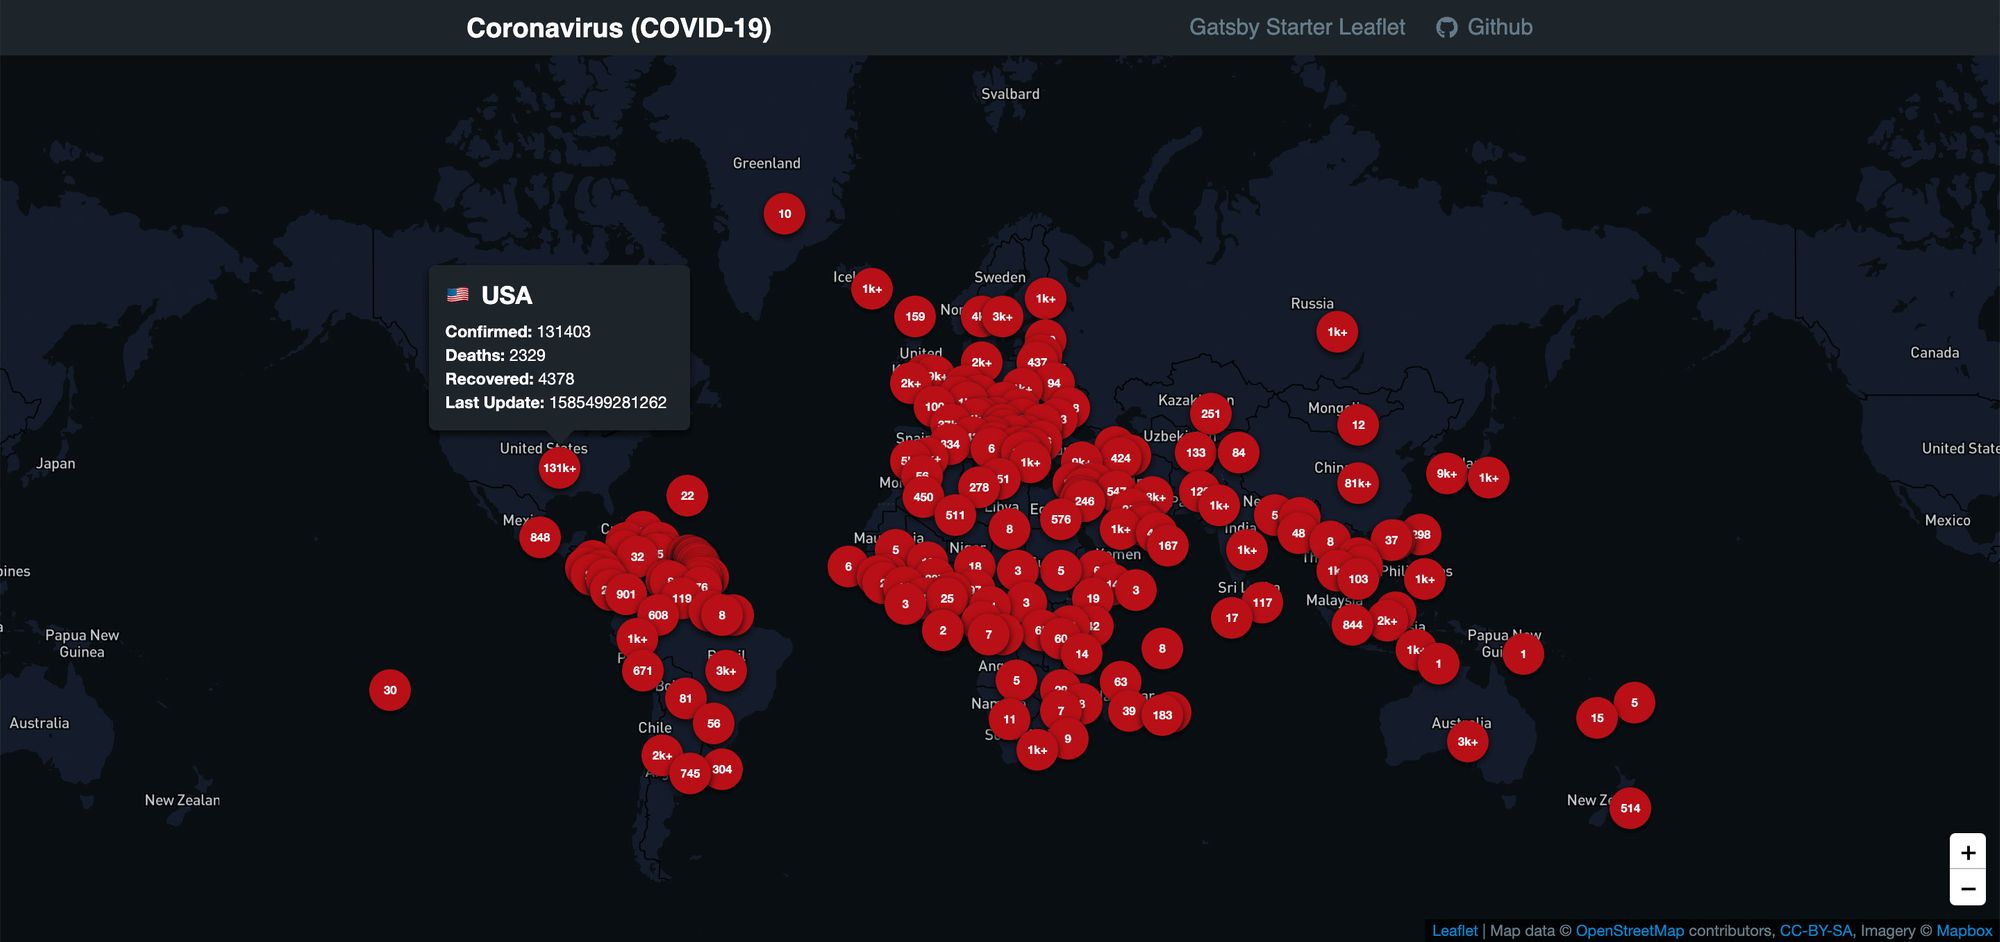 Coronavirus map dashboard demo
On the map, we’ll show a marker for each country with the number of confirmed cases. On top of that, we’ll include a little popup tooltip that shows more in depth information.
The map we’ll build will mostly look like the above, but will look a little simpler. We’ll utilize the OpenStreetMap public tileserver instead of using a custom Mapbox
To get started, we’re going to use this Leaflet Gatsby Starter I created to make the initial setup a little smoother. With our app bootstrapped, we’ll fetch our data and add markers to the map with our data.
Woah, a mapping app?
Yup. If you haven’t played with maps before, don’t be discouraged! It's not as bad as you probably think. If you’d rather start with mapping basics, you can read more about how mapping works first.
What do we need before we get started?
If you followed along with my previous tutorials for building a Santa Tracker or creating a Summer Road Trip map, you can follow the same steps to get started. If not, we’ll want to make sure we have the following set up:
- node or yarn - I'll be using yarn, but you can substitute with npm where appropriate
- Gatsby’s CLI -
yarn global add gatsby-cli
If you’re not sure about one of the above, you can try checking out the beginning my previous tutorial.
We’ll also want to set up a foundation for our map. We can do this by utilizing the Leaflet Gatsby Starter I put together that provides us a basic setup with Leaflet and React Leaflet.
gatsby new my-coronavirus-map https://github.com/colbyfayock/gatsby-starter-leaflet
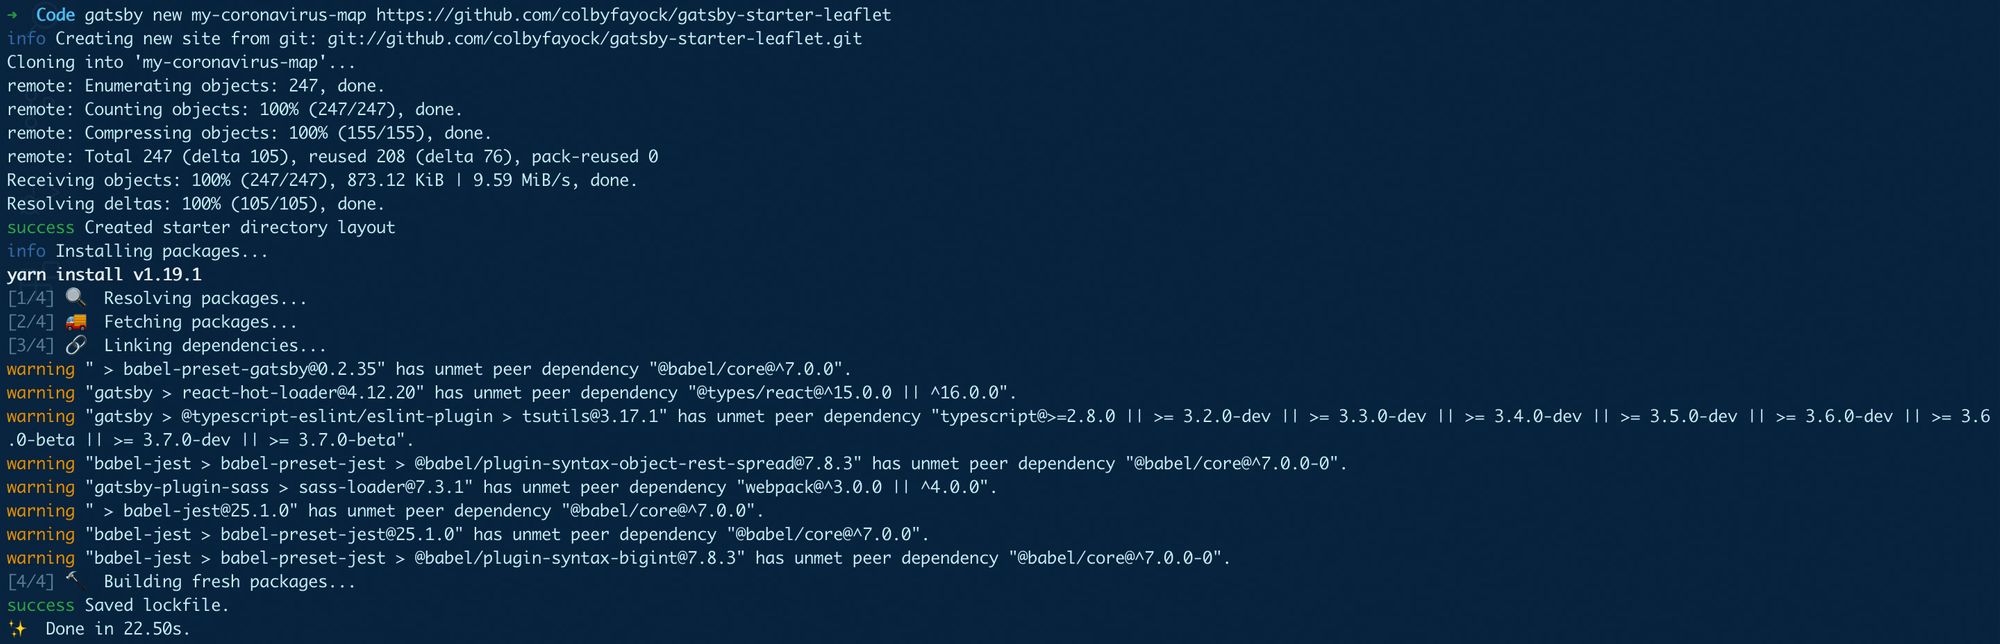 Creating a new Leaflet Gatsby app in the terminal
After that’s finished running, you can navigate to the newly created project directory and start your local development server:
cd my-coronavirus-map
yarn develop
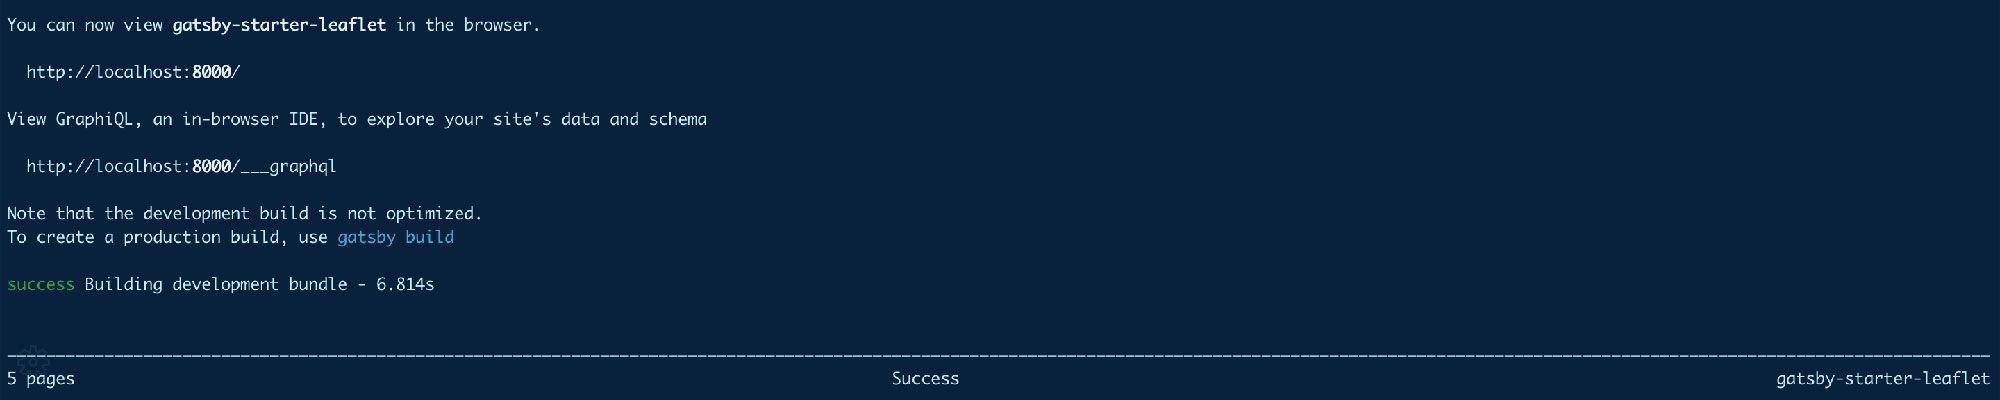 Starting your Gatsby app in the terminal
If all goes as planned, your server should start and you should now be able to see your basic mapping app in your browser!
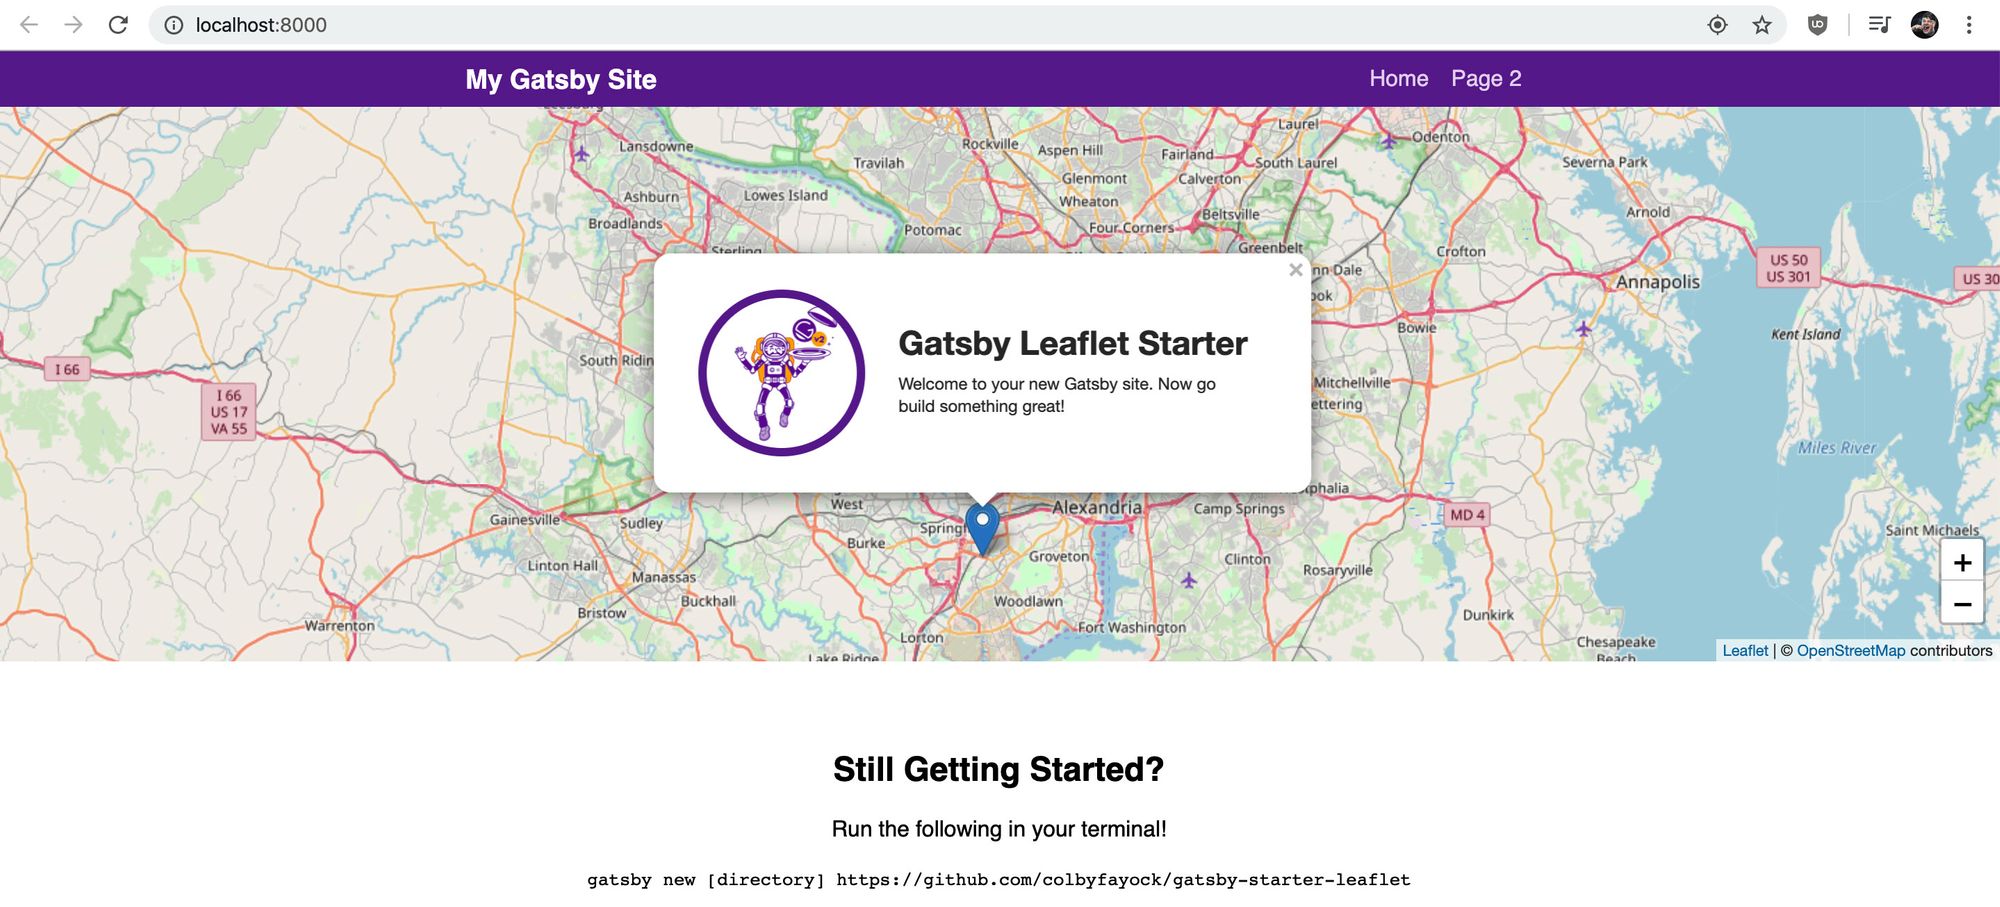 New Leaflet Gatsby app in the browser
Step 1: Cleaning up some unneeded code
The Gatsby Starter we're using to spin up this app comes with some demo code that we don’t need here. We’ll want to make all of the changes below in the file src/pages/index.js, which is the homepage of our app.
First, let’s remove everything from the mapEffect function. This function is used to run code that fires when the map renders.
// In src/pages/index.js
async function mapEffect({ leafletElement } = {}) {
  // Get rid of everything in here
}
We’ll also change the variable name of our leafletElement simply for being able to more easily understand the code as we write it.
async function mapEffect({ leafletElement: map } = {}) {
}
Next, we don’t want a marker this time, so let’s remove the <Marker component from our <Map component:
<Map {...mapSettings} />
Now that we have those pieces cleared out, we can remove all of the following imports and variables from the top of our file:
- useRef
- Marker
- promiseToFlyTo
- getCurrentLocation
- gatsby_astronaut
- timeToZoom
- timeToOpenPopupAfterZoom
- timeToUpdatePopupAfterZoom
- ZOOM
- popupContentHello
- popupContentGatsby
- markerRef
After, our map should still work, but not do anything.
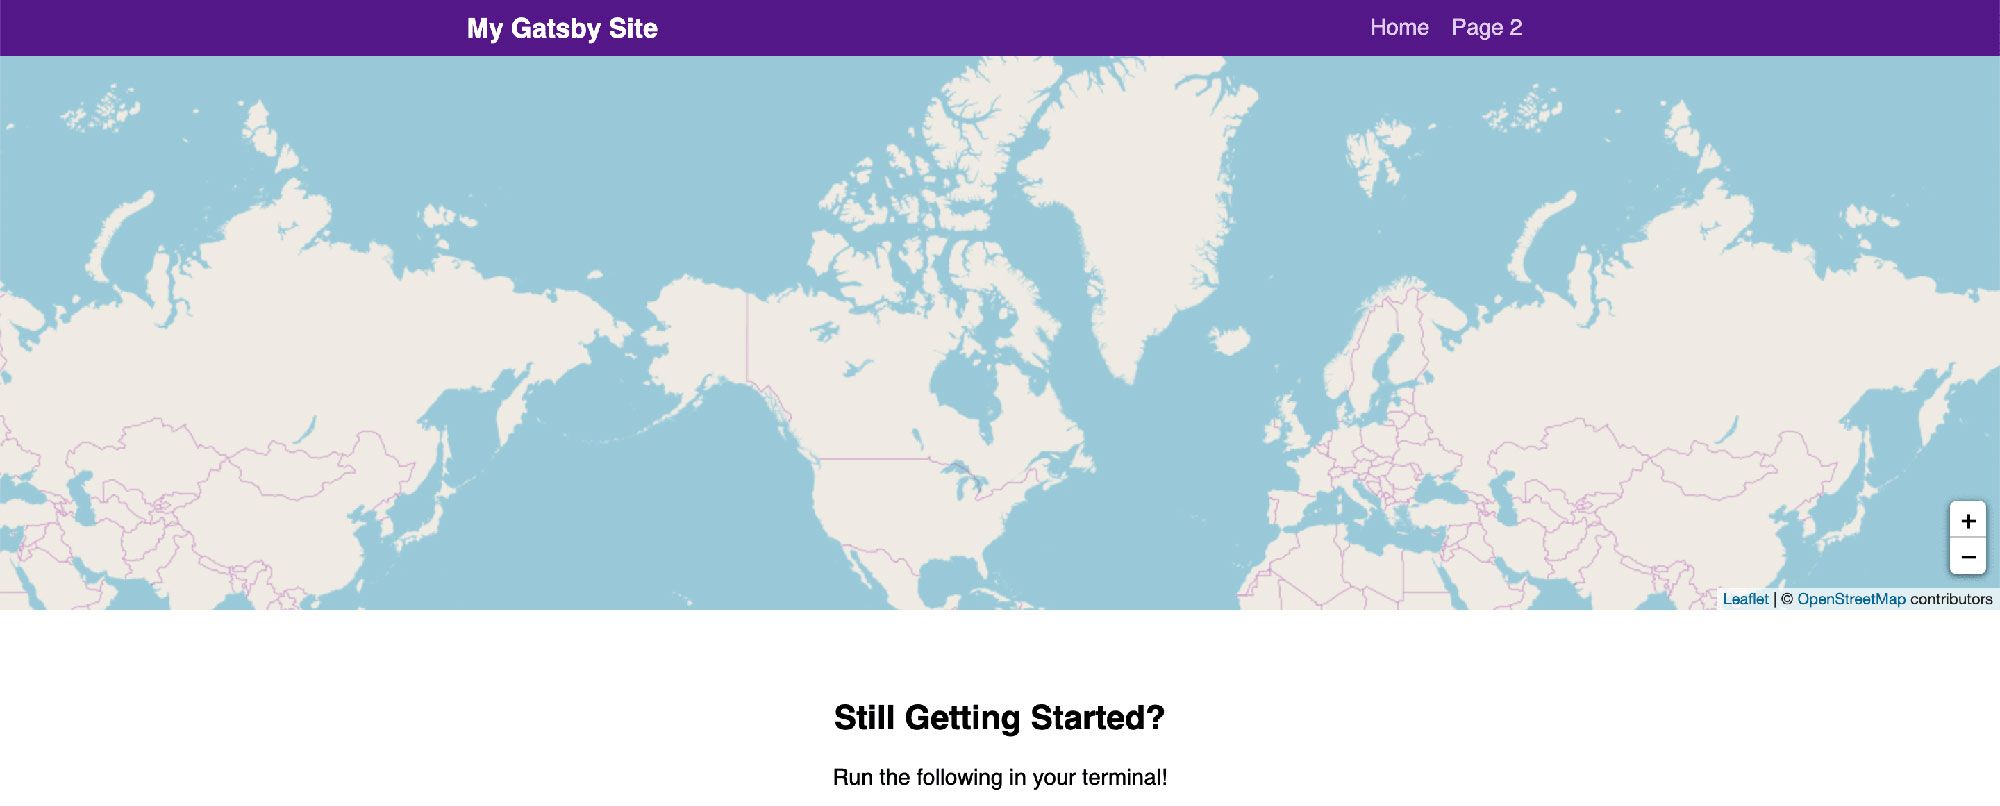 New mapping app with nothing going on
Step 2: Fetching the Coronavirus data
For our app, we’re going to use the NovelCOVID API. Particularly, we’re going to use the countries endpoint to fetch the list of our countries and the stats associated with them.
For making requests, I personally like to use axios as it has a nice to use API. If you want to use fetch or your own favorite request library, substitute that in for this step.
We’ll start by installing axios:
yarn add axios
Once that installs, remember to restart your server.
Import the axios package ta the top of our pages/index.js file:
import axios from 'axios';
Next we’ll actually make our request. Inside our mapEffect function, let’s try to make a request to the API endpoint:
async function mapEffect({ leafletElement: map } = {}) {
    let response;

    try {
      response = await axios.get('https://corona.lmao.ninja/v2/countries');
    } catch(e) {
      console.log(`Failed to fetch countries: ${e.message}`, e);
      return;
    }

    const { data = [] } = response;
}
In this snippet, we’re doing the following:
- Setting up a
responsevariable that will allow us to store the response - Adding a
try/catchblock that will catch any API errors if the request fails - If the request is successful, we store the response in the
responsevariable - If the request fails, we console log out the error and return out of the function so we don’t continue to run the code with a failed request
- Once we have our response, we can destructure
datafrom the response and set the default value to an empty array, as that will be the type of data we need
After that’s set up, we can console log out the data object and we’ll see our data successfully fetched!
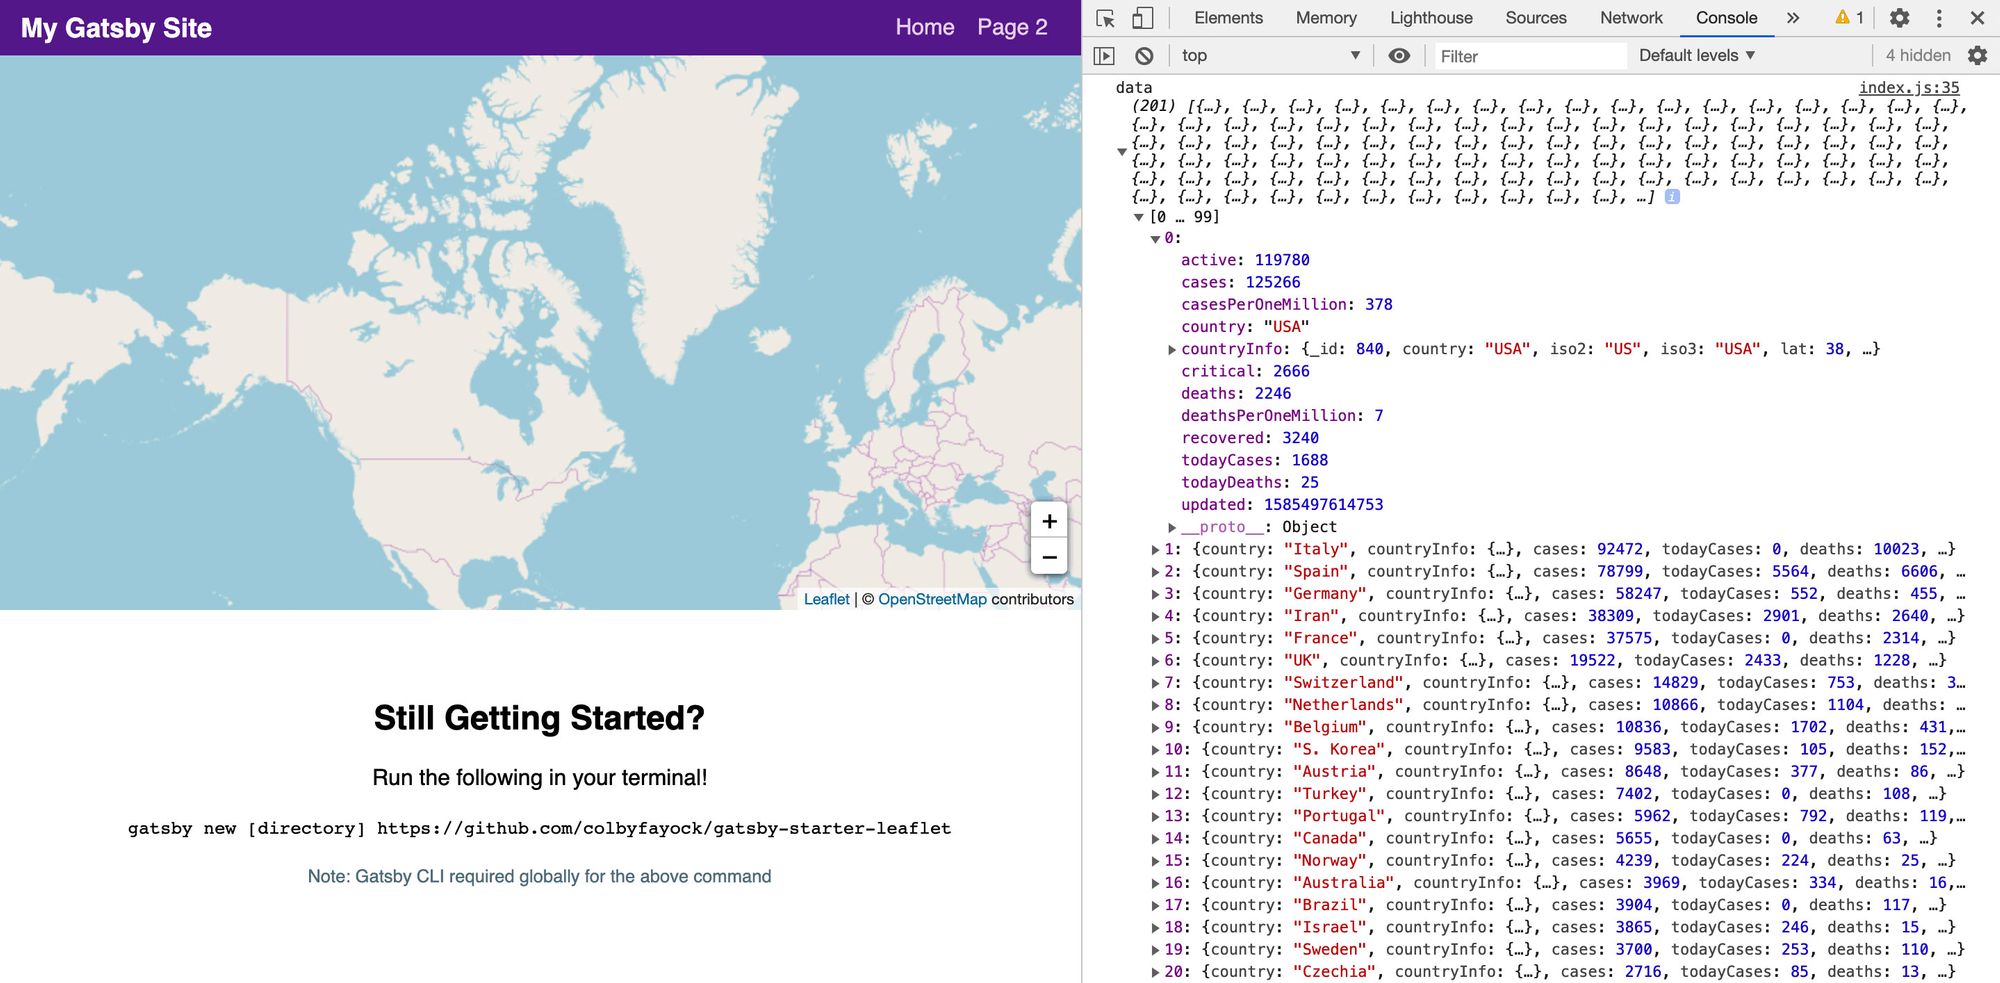 Logging the Coronavirus location data to the browser console
Update: The previous commit includes a link to the original NovelCOVID v1 API endpoint which has now been deprecated. Please use this instead: https://corona.lmao.ninja/v2/countries.
Step 3: Transform the Coronavirus data into a geographic data format
Now that we have our data, we can transform it into a geographic data format, particularly GeoJSON, that will allow us to interface with Leaflet.
Let’s start by adding this block of code:
const { data = [] } = response;
const hasData = Array.isArray(data) && data.length > 0;

if ( !hasData ) return;

const geoJson = {
  type: 'FeatureCollection',
  features: data.map((country = {}) => {
    const { countryInfo = {} } = country;
    const { lat, long: lng } = countryInfo;
    return {
      type: 'Feature',
      properties: {
       ...country,
      },
      geometry: {
        type: 'Point',
        coordinates: [ lng, lat ]
      }
    }
  })
}
So what are we doing here?
- We create a new constant called
hasDatathat checks if ourdatavariable is an array and has data - If we don’t have data, we want to return out of the function, as we don’t want to try to add data we don’t have
- We create a
geoJsonobject that will be our GeoJSON document - Our document is of type
FeatureCollectionand as ourfeatureswe loop through our dataset - For each country in our data, we obtain the
latandlngto create a point for our map - We additionally add our country data as properties so we can access it within our mapping APIs
If you console.log this object our into your browser and copy the contents, you can paste this into geojson.io and see the location data show up correctly.
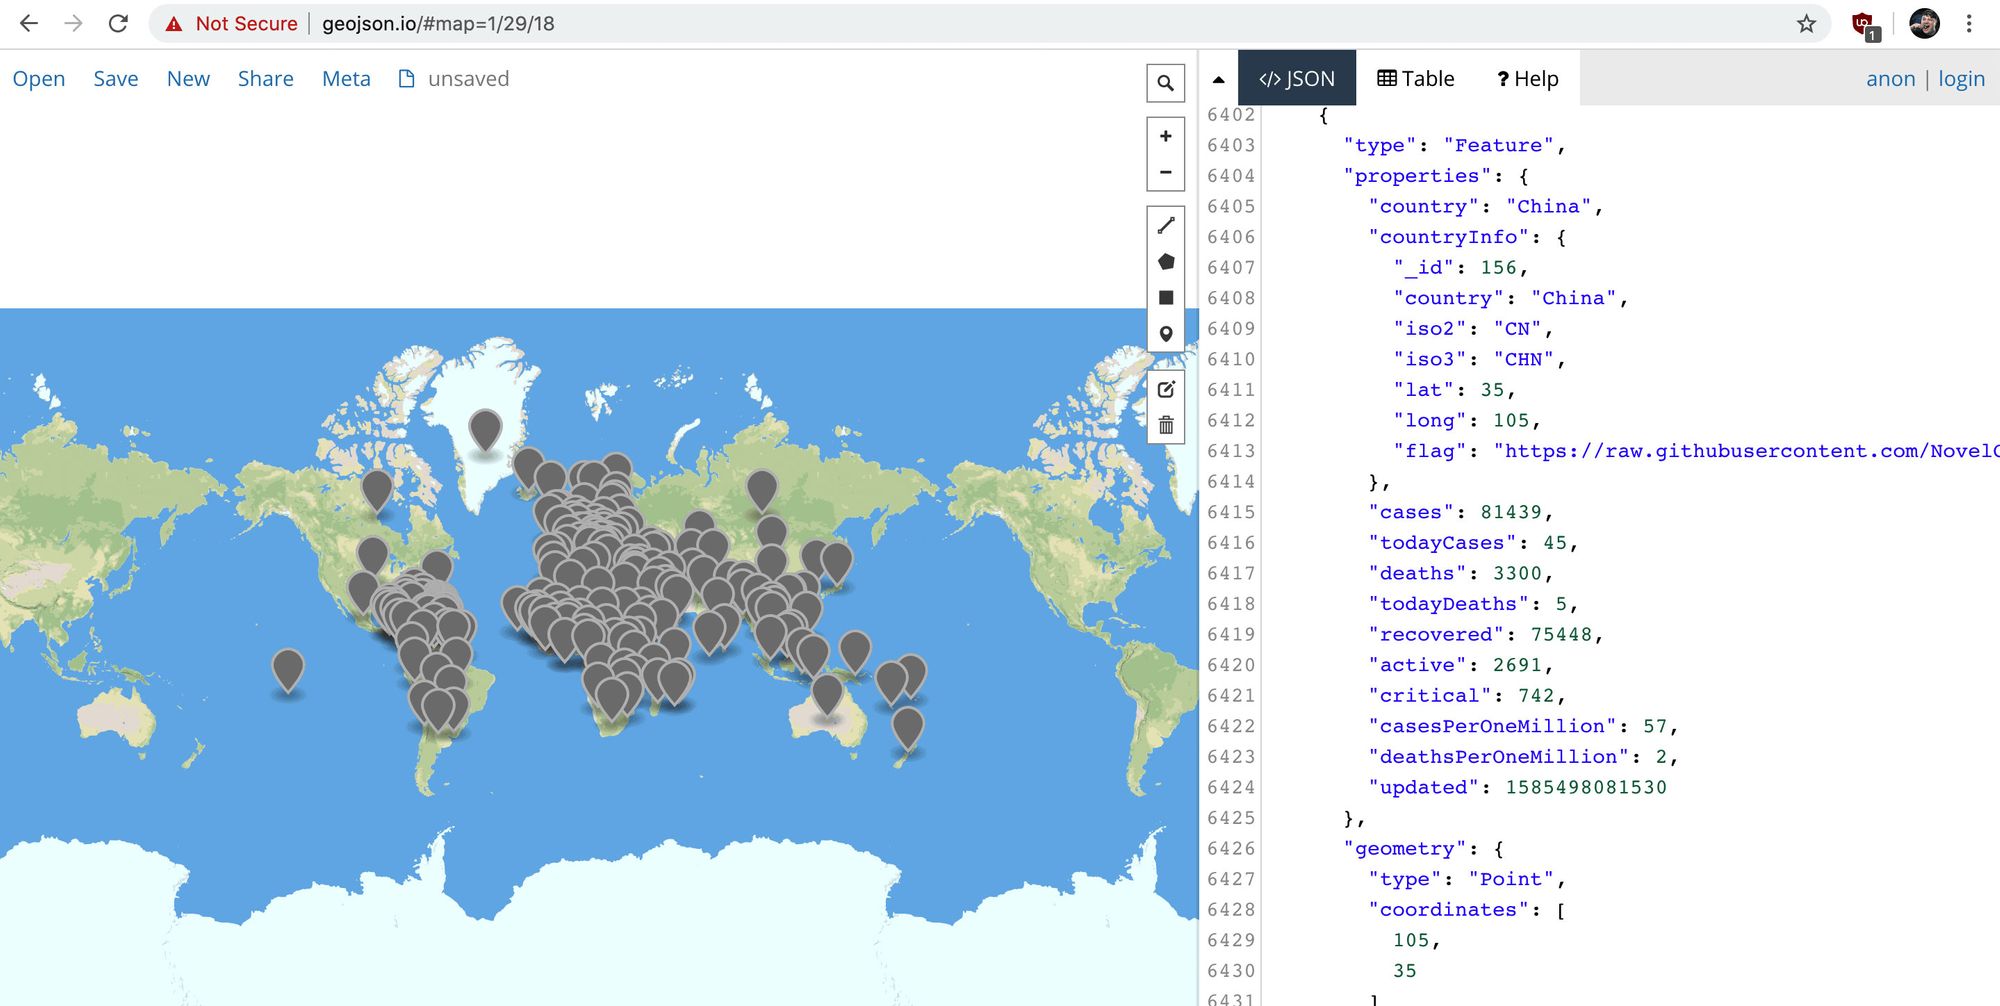 Previewing Coronavirus location data on geojson.io
With this GeoJSON document, we'll now be able to add it to our map.
Step 4: Adding the Coronavirus data to the map
We have our GeoJSON document with our location data, so let’s add it to the map.
Let’s start with this code block. It's a long one, but we’ll break it down piece by piece:
const geoJsonLayers = new L.GeoJSON(geoJson, {
  pointToLayer: (feature = {}, latlng) => {
    const { properties = {} } = feature;
    let updatedFormatted;
    let casesString;

    const {
      country,
      updated,
      cases,
      deaths,
      recovered
    } = properties

    casesString = `${cases}`;

    if ( cases > 1000 ) {
      casesString = `${casesString.slice(0, -3)}k+`
    }

    if ( updated ) {
      updatedFormatted = new Date(updated).toLocaleString();
    }

    const html = `
      <span class="icon-marker">
        <span class="icon-marker-tooltip">
          <h2>${country}</h2>
          <ul>
            <li><strong>Confirmed:</strong> ${cases}</li>
            <li><strong>Deaths:</strong> ${deaths}</li>
            <li><strong>Recovered:</strong> ${recovered}</li>
            <li><strong>Last Update:</strong> ${updatedFormatted}</li>
          </ul>
        </span>
        ${ casesString }
      </span>
    `;

    return L.marker( latlng, {
      icon: L.divIcon({
        className: 'icon',
        html
      }),
      riseOnHover: true
    });
  }
});
So what are we doing here?
- We create a new instance of
L.GeoJSONwhich will transform our GeoJSON document into something Leaflet will understand - Inside that instance, we define a custom
pointToLayerfunction. This allows us to customize the map layer Leaflet creates for our map - In our function, we assign and create our datapoints that we want. Most of it is destructuring, but we format the cases count to show
1k+instead of1000and a formatted date instead of the timestamp - We create an HTML string block which is used to define our map marker that will be added to the map. This also includes the HTML for the tooltip that will pop up when hovering over a marker
- We return
L.markerwith our custom configuration that includes a class oficonfor the container and our custom HTML. - Additionally, we add the
riseOnHoverproperty so when hoving over a marker, it surfaces itself above over the other markers on the map
We also want to add a bit of CSS here so that we can make sure our markers show up in the map and are usable. Let’s add this snippet to our assets/stylesheets/components/_map.scss file:
.icon-marker {

  display: flex;
  position: relative;
  justify-content: center;
  align-items: center;
  color: white;
  width: 3.6em;
  height: 3.6em;
  font-size: .7em;
  font-weight: bold;
  background-color: $red-800;
  border-radius: 100%;
  box-shadow: 0 2px 5px rgba(black, .9);

  &:hover {

    .icon-marker-tooltip {
      display: block;
    }

  }

}

.icon-marker-tooltip {

  display: none;
  position: absolute;
  bottom: 100%;
  width: 16em;
  font-size: 1.4em;
  padding: 1em;
  background-color: $blue-grey-900;
  border-radius: .4em;
  margin-bottom: 1em;
  box-shadow: 0 3px 5px rgba(black, .9);

  &:before {
    display: block;
    position: absolute;
    bottom: -.6em;
    left: 50%;
    content: '';
    width: 1.4em;
    height: 1.4em;
    background-color: $blue-grey-900;
    transform: rotate(45deg);
    margin-left: -.7em;
  }

  h2 {
    font-size: 1.5em;
    line-height: 1.2;
    margin-bottom: .1em;
    margin-top: 0;
  }

  h3 {
    font-size: 1.2em;
    margin: .1em 0;
    font-weight: normal;
    color: $blue-grey-100;
  }

  ul,
  p {
    font-weight: normal;
  }

  ul {
    list-style: none;
    padding: 0;
    margin: .6em 0 0;
  }

}
What we’re doing:
- We create our round markers using the
.icon-markerclass and set up our.icon-marker-tooltipclass to show up when hovered over - Our
.icon-marker-tooltipclass is hidden by default, as it’s our tooltip, but we position it absolutely to appear over top of our marker and formatted the way we want it
And finally, once we have our geoJsonLayers created with our styling added, we can add it to the map!
geoJsonLayers.addTo(map)
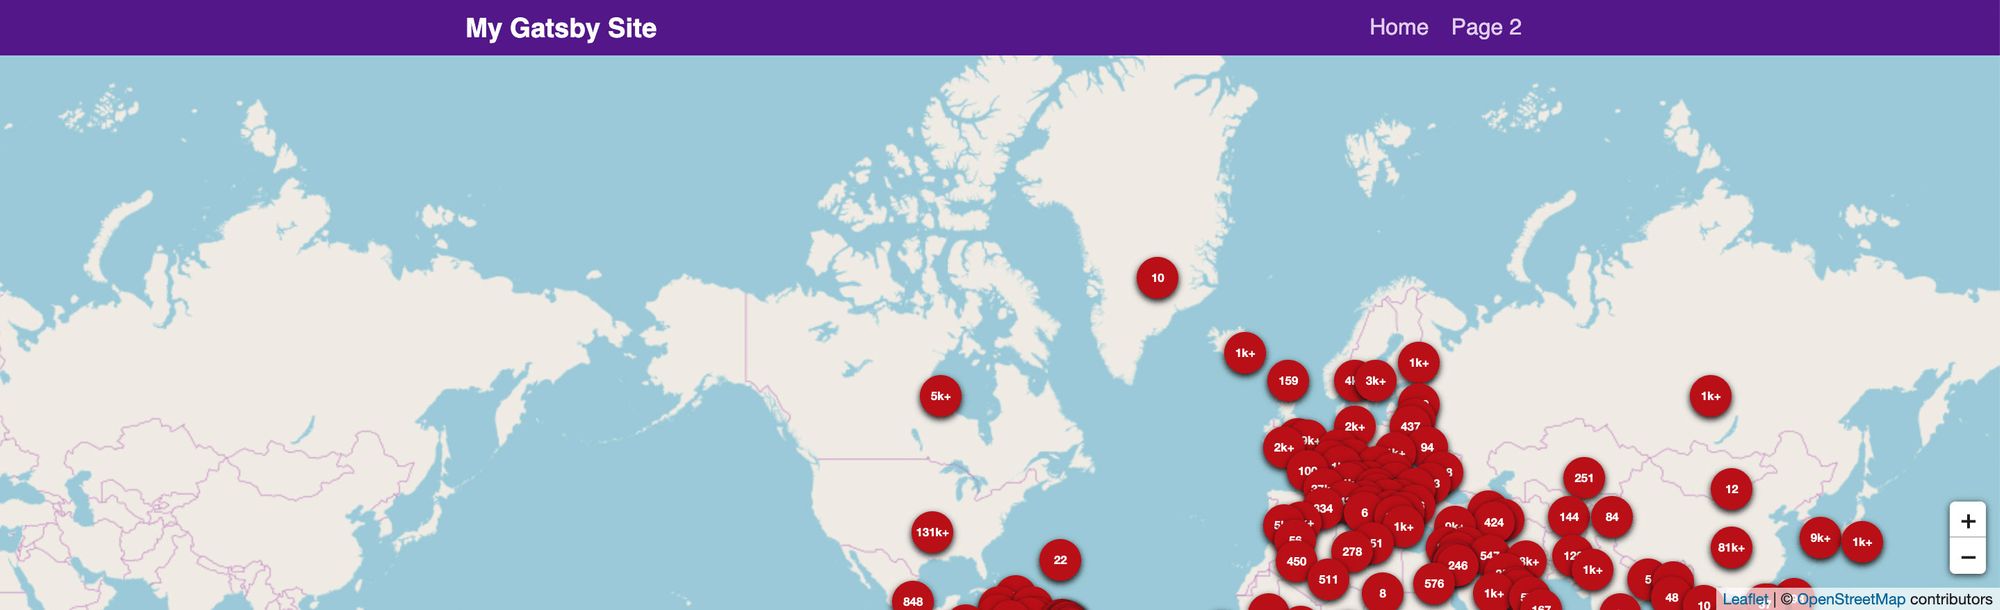 Map with Coronavirus location data
Now you might be wondering why it doesn't appear to be centering properly. Go ahead and change the LOCATION variable at the top of the index.js file to:
const LOCATION = {
  lat: 0,
  lng: 0
};
Once that’s set, when the page reloads, the map should be centered in the middle of the world!
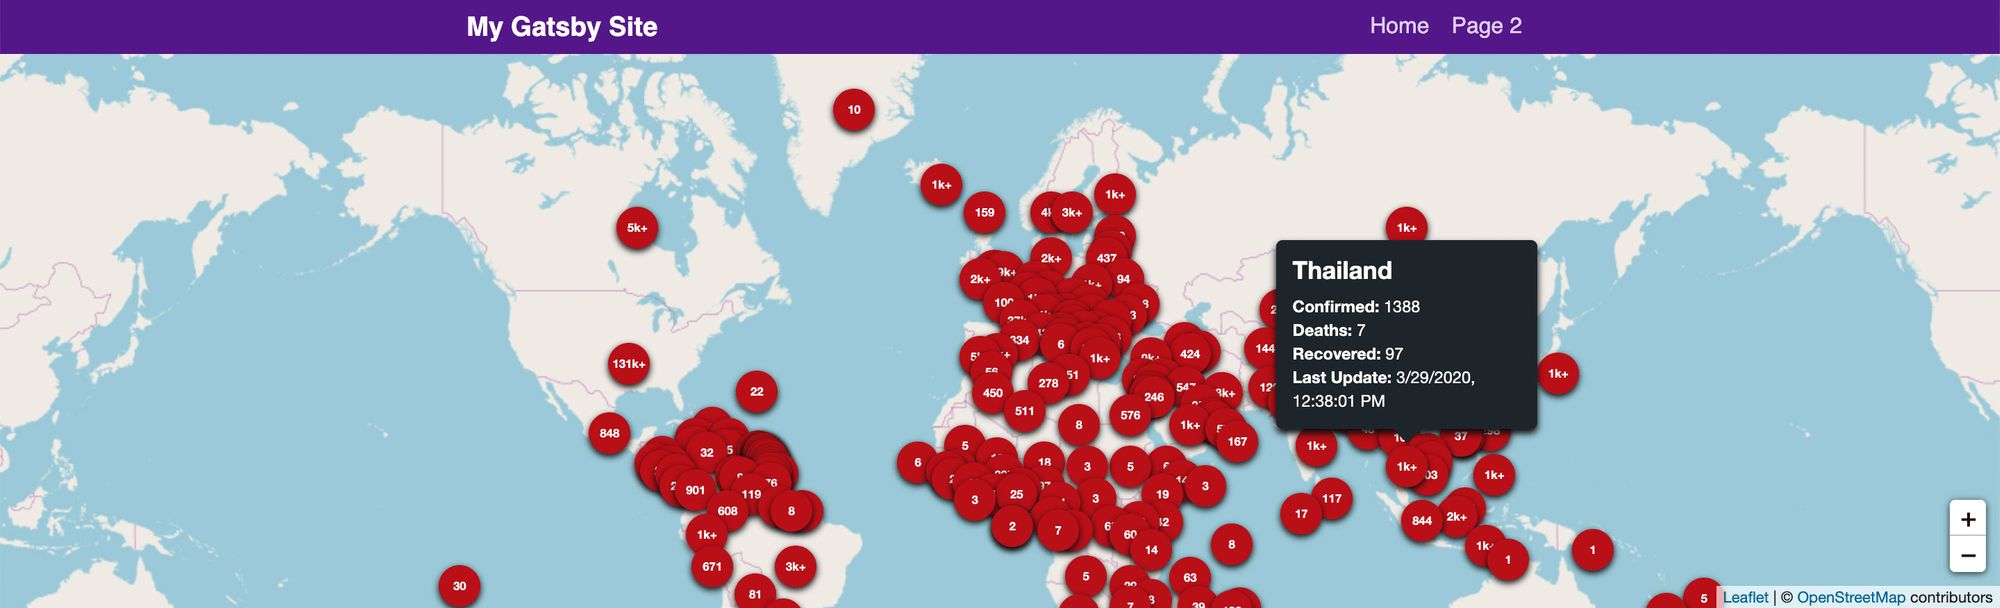 Map with Coronavirus location data centered with a tooltip
Yay, we did it! ?
If you followed along, you now have created your own Coronavirus map dashboard that gives some quick stats about the cases around the world.
Take what you learned and run with it. You can apply this to any other type of data that you can imagine.
What else can we do?
Add more styles and a custom basemap
In my original demo, I set up a custom basemap using Mapbox that allows me to have a dark background making the markers easier to see.
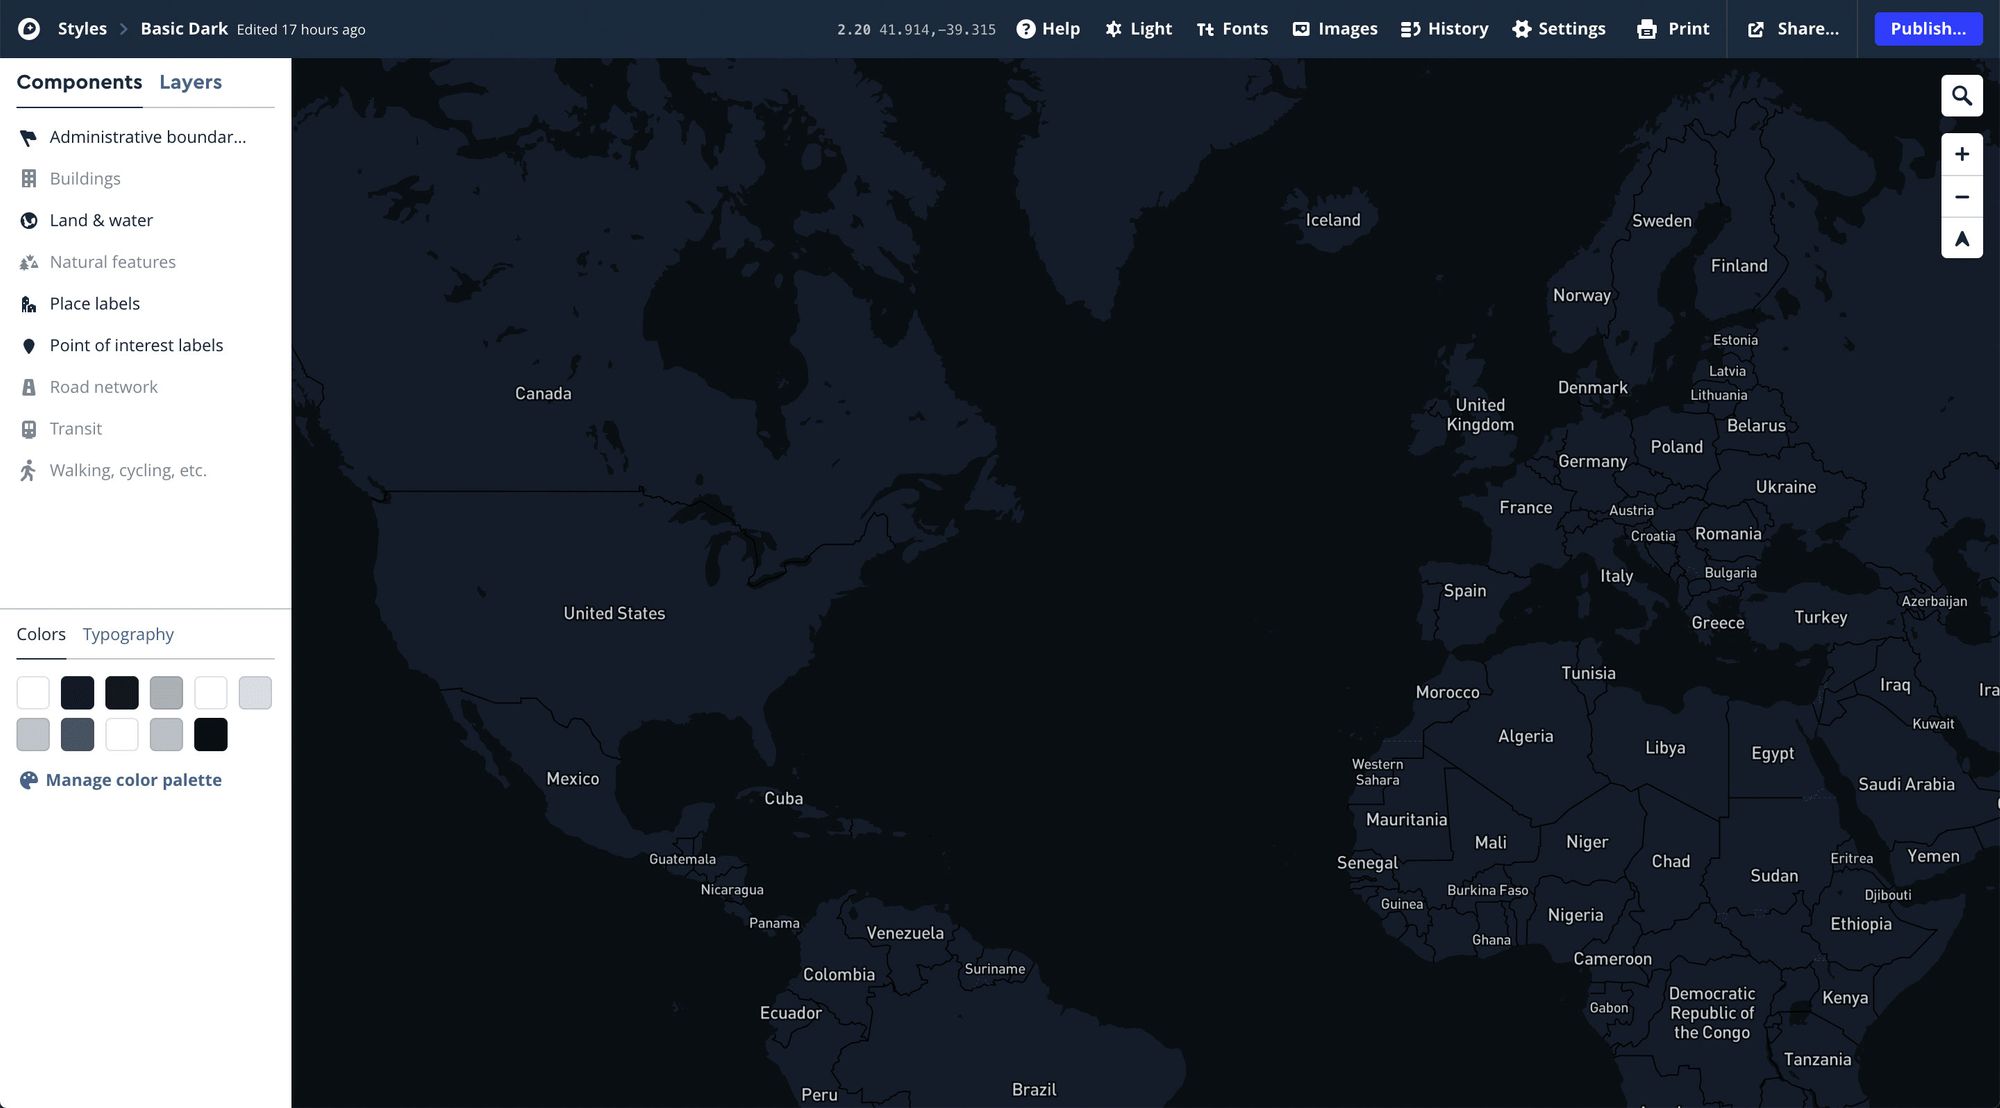 Creating a new basemap in Mapbox Studio
Mapbox is great and has a nice free tier if you’re interested in getting started.
Once you have a Mapbox account, you can even copy the style I used and make it your own.
To learn how to integrate it, you can try to check out the source code of my original demo:
https://github.com/colbyfayock/coronavirus-map-dashboard
Add overview dashboard stats
Dashboards with maps like the Johns Hopkins University app allows us to see more than a look on the map, but a glimpse at quick stats about the cases around the world.
 Johns Hopkins University Coronavirus Map Dashboard - March 29, 2020
The NovelCOVID API has more endpoints like /all that provide a few global stats.
Be safe and stay informed
I want to reiterate that you should make sure you're staying up to date using official sources for information, such as the Johns Hopkins University dashboard. Though the data should be reliable, it should also be considered a proof of concept for building a map and referencing, but shouldn't be considered for any kind of statistical analysis.
Please take care of yourself during these times. We're all in this together! ❤️
Want to learn more about maps?
You can check out a few of my other resources to get started:
- Anyone Can Map! Inspiration and an introduction to the world of mapping
- How to set up a custom Mapbox basemap style with React Leaflet and Leaflet Gatsby Starter
- How to Create a Summer Road Trip Mapping App with Gatsby and Leaflet
- How to Create your own Santa Tracker with Gatsby and React Leaflet
- How to build a mapping app in React the easy way with Leaflet