By Siben Nayak
In my previous article, I wrote about metrics and how they help you gain visibility into the operational health of your hardware and software systems.
Wavefront is a high-performance streaming analytics platform that supports 3D observability (metrics, histograms, traces/spans).
It can scale to very high data ingestion rates and query loads. You can collect data from many services and sources across your entire application stack, and can look at details for earlier data collected by Wavefront.
Terraform is an open-source “Infrastructure as Code” tool, created by HashiCorp.
It is a declarative coding tool and enables developers to use a high-level configuration language called HCL (HashiCorp Configuration Language) to describe the desired “end-state” for the infrastructure.
This infrastructure can be on the cloud or on-premises. It then generates a plan for reaching that end-state and executes the plan to create the infrastructure.
In this article, we will take a look at how we can use Terraform to write code that will automatically build dashboards and alarms in Wavefront. This is really helpful in maintaining a DevOps culture in your team, where all the monitoring infrastructure is maintained as code and checked into your version control system such as GitHub.
How to Install Terraform
Depending on your OS, the installation instructions for Terraform will vary. This article covers the instructions for installing it on macOS.
The recommended approach for installing it on macOS is to use the Homebrew package manager.
Install Terraform
Verify that you have Homebrew installed, like this:
$ brew --version

Homebrew/homebrew-core (git revision fe68a; last commit 2020-10-15)
Homebrew/homebrew-cask (git revision 4a2c25; last commit 2020-10-15)
If not, you can install Homebrew using the following command:
$ /bin/bash -c "$(curl -fsSL https://raw.githubusercontent.com/Homebrew/install/master/install.sh)"
Next, install Terraform using the following commands:
$ brew tap hashicorp/tap
$ brew install hashicorp/tap/terraform
Verify Terraform Installation
To verify that Terraform is properly installed, open another terminal session, and try a Terraform command.
$ terraform --help

Usage: terraform [global options] <subcommand> [args]

The available commands for execution are listed below.The primary workflow commands are given first, followed byless common or more advanced commands.
How to Get an API Token
To allow Terraform to access your Wavefront installation, you will need to provide it an access token. This token can be found in the API tokens section of your account.
Go to Gear Icon > Account Name > API Access
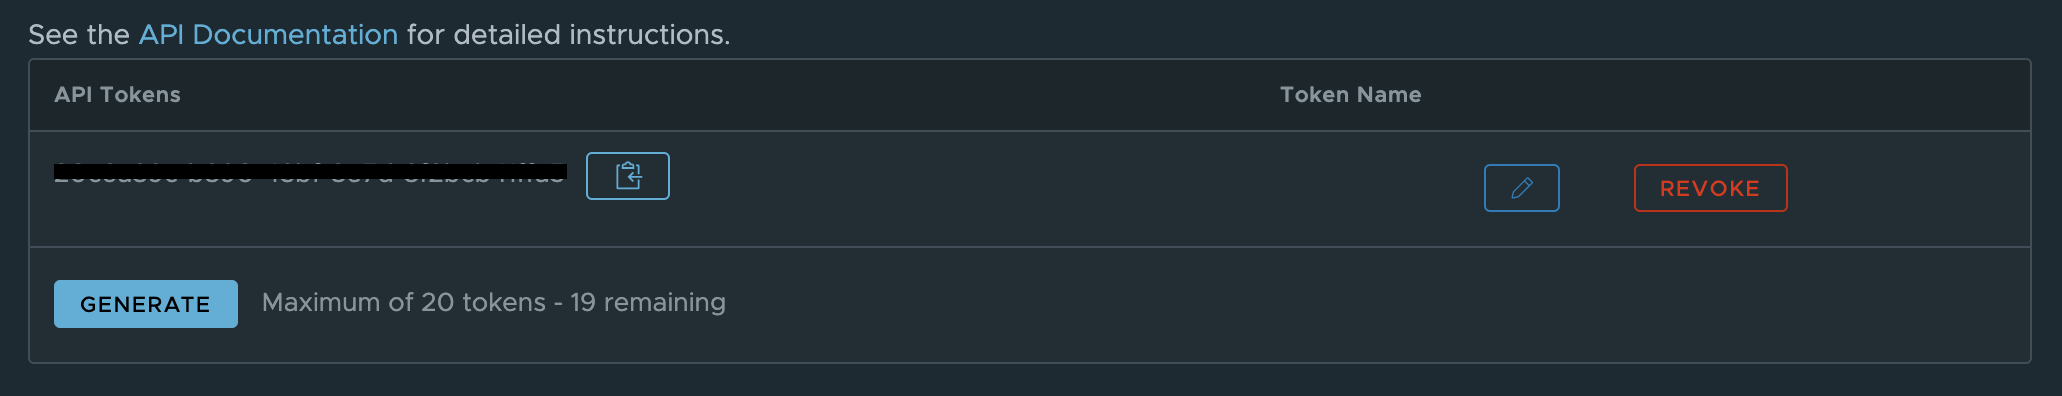 Getting your Wavefront API Token
How to Setup a Terraform Project
First, create a new folder for your Terraform project:
$ mkdir wavefront-terraform
A usual Terraform project contains 3 major files:
- versions.tf — this contains the Terraform provider declaration that specifies the plugin version to be used
- variables.tf — this contains the variables that you can refer to in your main Terraform code
- main.tf — as the name suggests, this contains the actual code required to build the resources
Create a versions.tf file in the project folder and add the following code:
Next, run the terraform init command to initialize the Wavefront provider:
$ terraform init
This downloads the terraform-wavefront-provider-<version> file and puts it inside a.terraform folder in the current project folder.
Next, create a main.tf file in the project folder and add the following code:
With the setup completed, we are now ready to create some dashboards and alerts.
How to Create Wavefront Dashboards
Before we jump into creating dashboards, let us first understand the anatomy of a Wavefront dashboard.
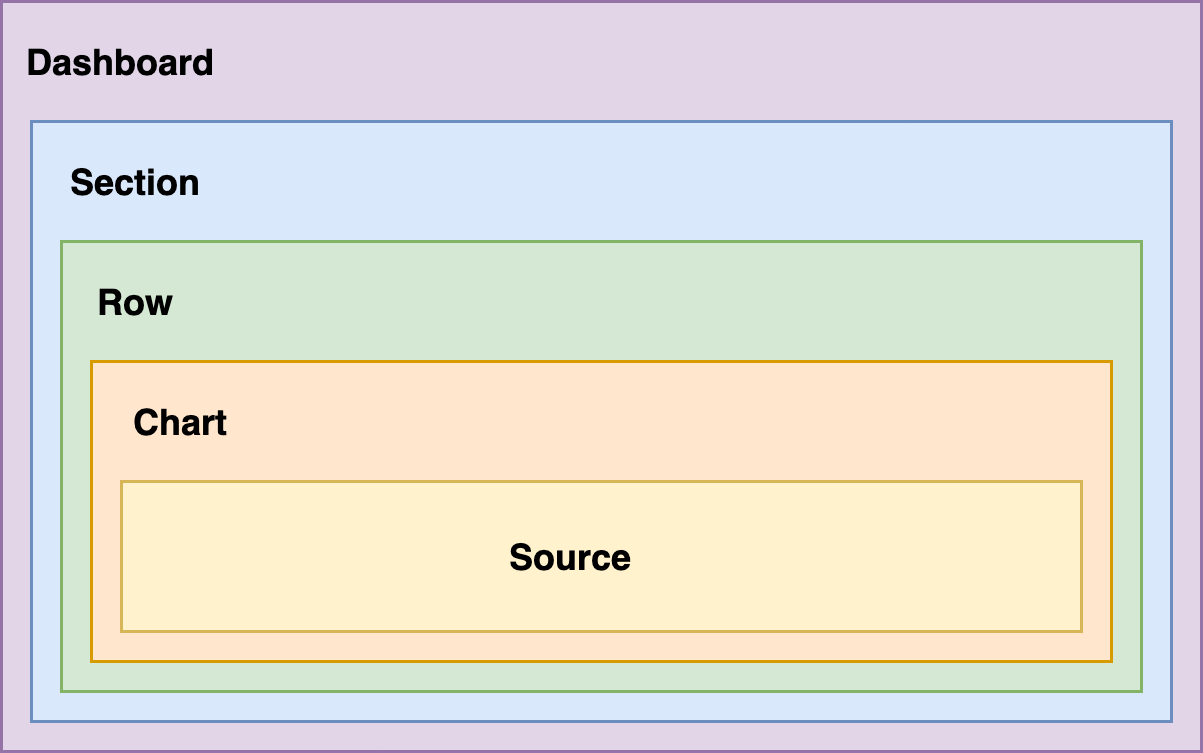 Anatomy of a Wavefront Dashboard
A dashboard in Wavefront consists of 5 types of entities:
- Dashboard — This is the main dashboard and contains all other entities.
- Section — A dashboard can contain one or more sections. A section is a logical group of charts. For example you can have one section for displaying charts related to hardware utilization, and another section for displaying charts related to API calls.
- Row — A row is a collection of charts. You can define the number of charts you want to be present in a row. My personal recommendation is to have 3 charts in a row. Anything more than that clutters the dashboard.
- Chart — This is the final chart that displays the metrics on the dashboard. There are various options for creating charts like line charts, bar charts, pie charts, and so on.
- Source — A chart can contain one or more sources. Each source has a query that works on an underlying metric to create a visual representation on the chart.
Now we are ready to write some code to create a dashboard. Add the following code to the main.tf file:
This creates a dashboard with one section for EC2 Metrics. There is one row in this section with two charts. One chart displays CPU Utilization and the other displays Memory Utilization. Both of them are line charts and show the percentage of usage.
How to Create Alerts
The dashboard we created is great to look at the CPU and Memory utilization of our EC2 instances. But if we want to be notified when the CPU or memory utilization increases beyond a certain threshold, we need to set up some alerts.
To create an alert on CPU Utilization, add the following code to the main.tf file:
This creates two resources:
- An alert target that sends an email to the specified address whenever an alert is opened or resolved.
- An alert on CPU Utilization that fires when the CPU utilization crosses the given threshold (a WARN alert when it goes over 60% and a SEVERE alert when it goes over 80%).
Wavefront continuously monitors the CPU utilization and sends a notification to the email address when the threshold is breached. Similarly, when the utilization becomes normal, it sends another notification indicating that things have recovered.
How to Generate Resources in Wavefront
The code for creating our resources is ready. Now we need to apply them so that the actual resources are created on Wavefront.
To view what changes will be made to Wavefront by our code, run the following command:
$ terraform plan
This will verify our code and show the difference between the current setup in Wavefront, and the changes that will happen due to your code.
Finally, to create the resources on Wavefront, run the following command:
$ terraform apply -auto-approve
This will upload the configuration to Wavefront and create the actual dashboard and alert. You can now go to Wavefront and verify these resources.
Conclusion
Congratulations! You just created a new Wavefront dashboard and alert through code.
You can now go ahead and make any modifications to your code, and run terraform apply -auto-approve to apply your changes to Wavefront.
Terraform is a great way to maintain your resources in the form of code that can be checked into your version control system. This allows multiple developers to work on your resources while also keeping track of the changes.
The full source code for this tutorial can be found here.
Thank you for staying with me so far. Hope you liked the article. You can connect with me on LinkedIn where I regularly discuss technology and life. Also take a look at some of my other articles. Happy reading. 🙂