
If you're a web developer, you probably appreciate a well-designed and attractive website.
And you might see a color scheme or font on a specific website that you want to incorporate into your blog or web app. But you'll need a browser extension to see the website's color scheme and other CSS features.
The CSS overview feature in Chrome Dev Tools lets you see these CSS properties.
In this post, we'll go over how to use the CSS overview feature in Chrome Developer Tools. We'll also learn how to use CSS overview to get the colors and other CSS properties you want to use in creating a web page.
Let's get started. 💃
What is the CSS overview panel?
The CSS overview panel is one of the newest features of Chrome Developer Tools. It serves as a preview tool that allows you to see the different CSS properties used in creating a web page.
It displays CSS properties such as:
- The colors used on a web page.
- The line height of each element used on a web page.
- The font-size of each element used on a web page
- The font-families of each element on a web page.
- The font weights of each element used on a web page.
What are Chrome Developer Tools?
Chrome Developer Tools is also known as Chrome Dev Tools.
Chrome Dev Tools are a suite of web developer tools that come pre-installed in the Chrome browser.
Check out this article to know more about Chrome developer tools.
Here are some of the advantages of using Chrome Dev Tools:
It enables you to create better websites in a shorter amount of time.
It enables you to make changes to your code, test it, and inspect it.
Chrome Dev Tools give developers more control over their web applications and browsers.
It enables you to assess the general performance of a website.
How to Access Chrome Developer Tools in Your Browser
You can access Chrome Developer tools in three different ways:
Chrome’s Menu:
Click on the three vertical dots located on the top right corner of your chrome browser. It will bring up a drop-down menu with
more toolsat the bottom of the screen.Click on more tools.
Click on developer tools.
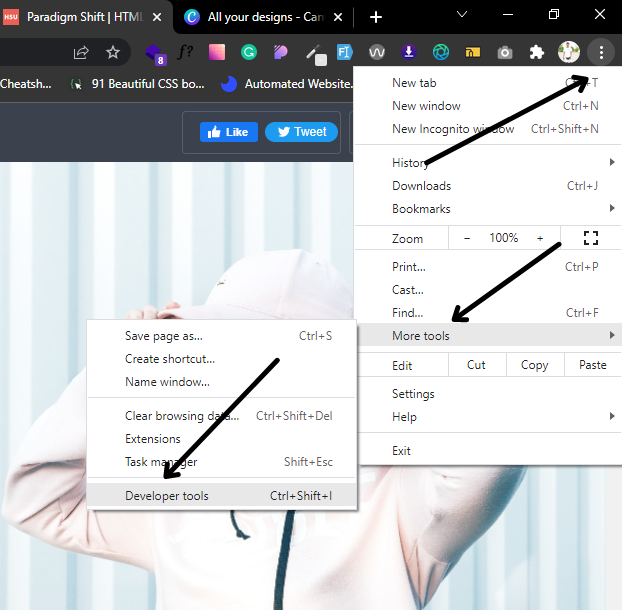
Inspect:
Right-click on the chrome browser.
Click on inspect.

Shortcuts:
For Windows -
CTRL+Shift+IORF12.For Mac -
CMD+Shift+I.
Once you click on the shortcut keys, the developer tools open.
When you press CTRL + Shift + I, it displays the last panel you opened by default. It shows the element, console, network, or performance panel, among other things.
CTRL + Shift + C opens the element panel first by default.
How to Use CSS Overview in Chrome Dev Tools
The steps below will walk you through how to use the CSS overview feature to get the CSS properties used on a web page.
Step 1 - Open Chrome Dev tools
We've already covered the various methods for accessing Chrome developer tools. You should be familiar with them now.
As a quick reminder, you can open Chrome dev tools by pressing Ctrl + Shift + I on Windows and Linux. Use CMD + Option + I on Mac.
Step 2 - Click on More tools
Click on the three vertical dots located on the top-right of Chrome dev tools.
Select "More Tools" from the drop-down menu.
You'll discover a variety of options when you click "More Tools." From the various options, select the CSS overview feature.

Step 3 - Click on Capture Overview
When you click on CSS Overview, you'll see a list of its functions.
Functions such as:
Capture an overview of your page's CSS.
Identify potential CSS improvements.
Locate the affected elements in the element panel.
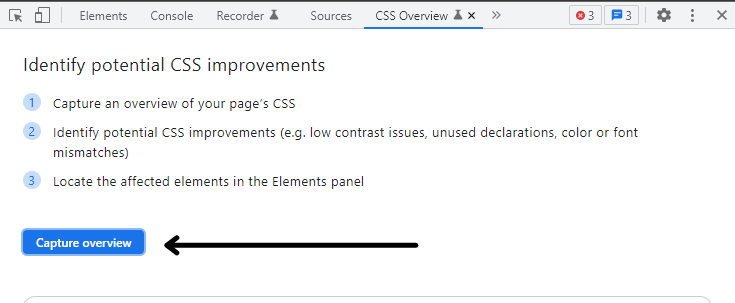
Click on the Capture Overview button.
A menu with five sections appears after clicking the Capture Overview button.
The five sections are:
- Overview summary
- Colors
- Font info
- Unused declarations
- Media queries
Let's go over each of the five sections one by one to see how they work.
CSS Overview Summary
The Overview summary contains a list of the CSS elements used in building the web page.
The Overview summary displays a summary of the CSS on your website, such as:
- The number of elements used on the web page.
- The different types of selectors used in creating the web page.
- The number of inline style elements used on the web page.
- The number of external stylesheets used on the web page.
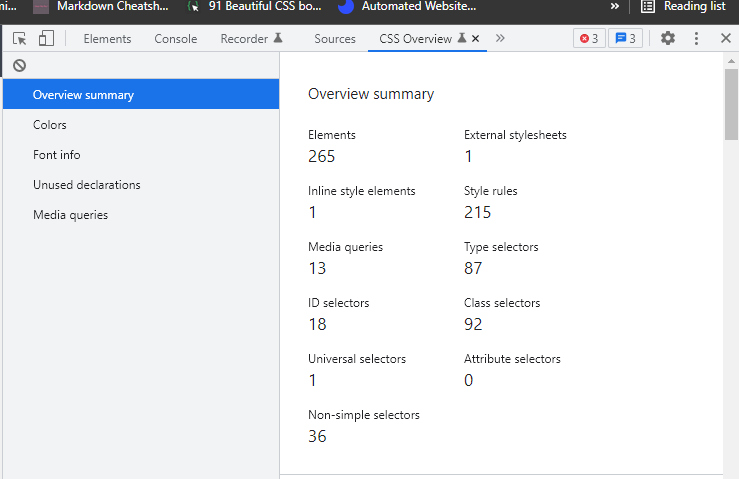 An Illustration of the overview summary.
The example above shows the various CSS elements used to build the web page.
Colors
The color panel displays all the colors used in creating the web page. It has a palette of colors for the background, text, fill, and borders. It also highlights low-contrast texts issues on the web page.
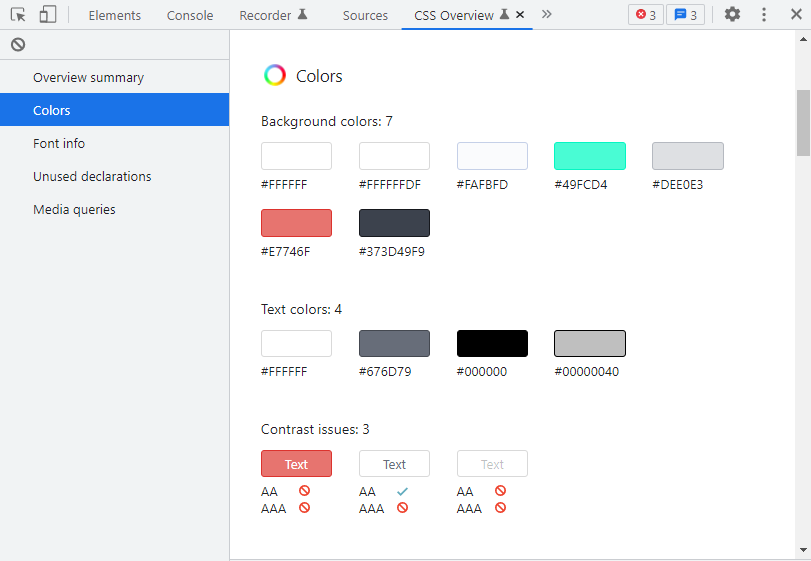 An illustration of the color panel.
The image above shows you the different colors used in creating the web page.
The beauty of the Color panel is that each color is clickable. If you click on a particular color in the Color panel, a list of elements that use that color appears. When you click on each element, it takes you to the element panel for inspection.
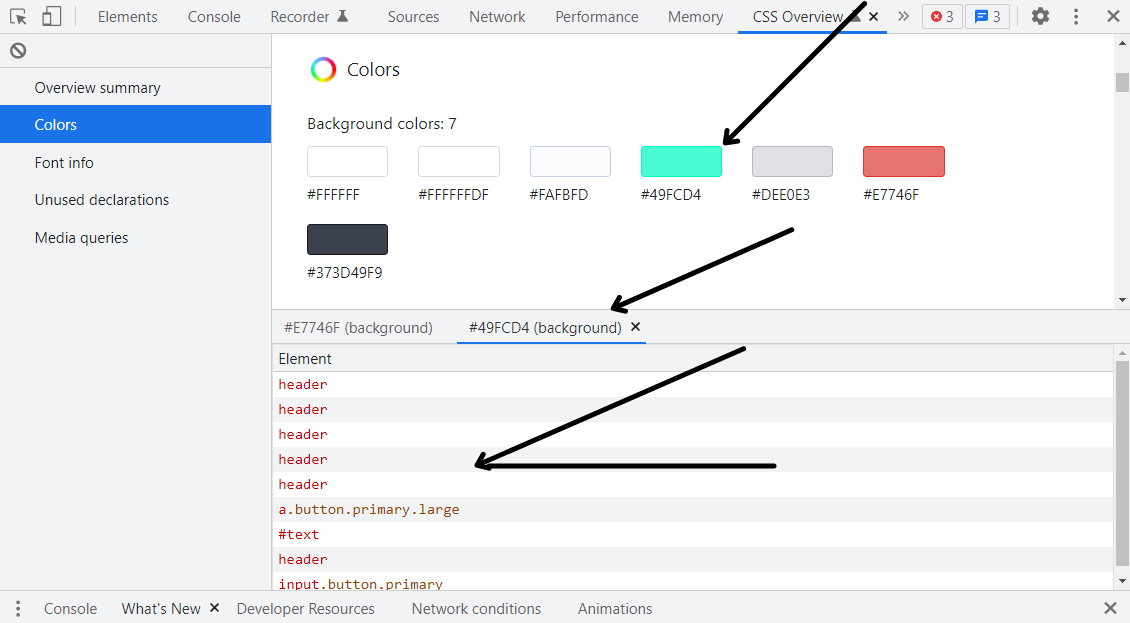
I clicked on color #49FCD4 in the image above, and it brought up a list of elements with that color.
You can also hover over an element in the lists of elements displayed. When you move your cursor over the element, it highlights the element on the web page.
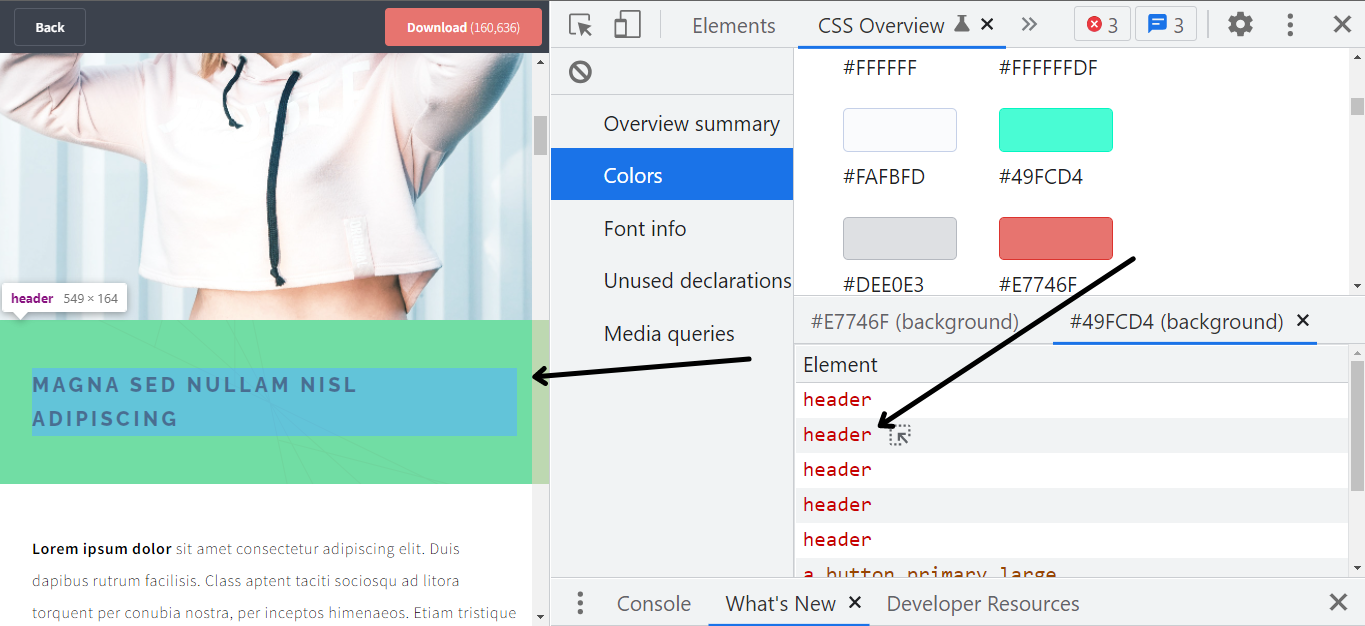
When I hover my mouse over the header element in the image above, it highlights the header on the web page.
Just a quick note: hovering refers to moving your cursor over anything. It means to place a cursor over text, an image, or other objects on the screen without clicking on them.
Font Info
The font info panel displays the typefaces used in the development of the website. It shows you the font-size, line-height, font-weight, and font families used in creating the website. If you click on the occurrences, you will see a list of the affected elements.
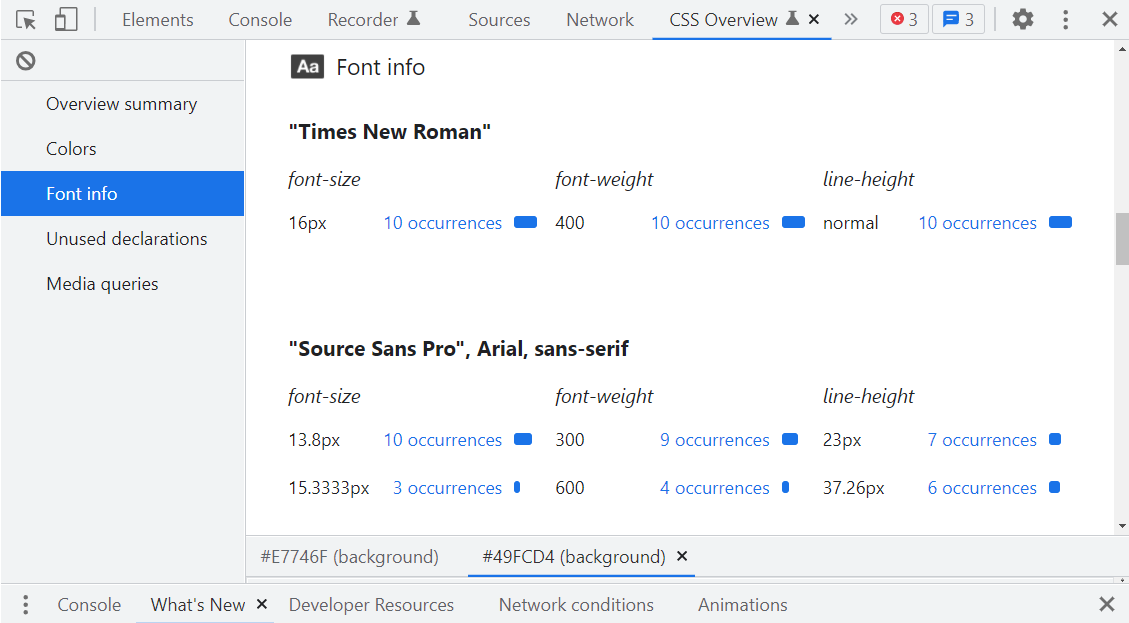 An illustration of the font info panel.
The above image shows you the different typefaces used in creating the web page.
Unused Declarations
You can find CSS styles that do not affect the web page by using unused declarations.
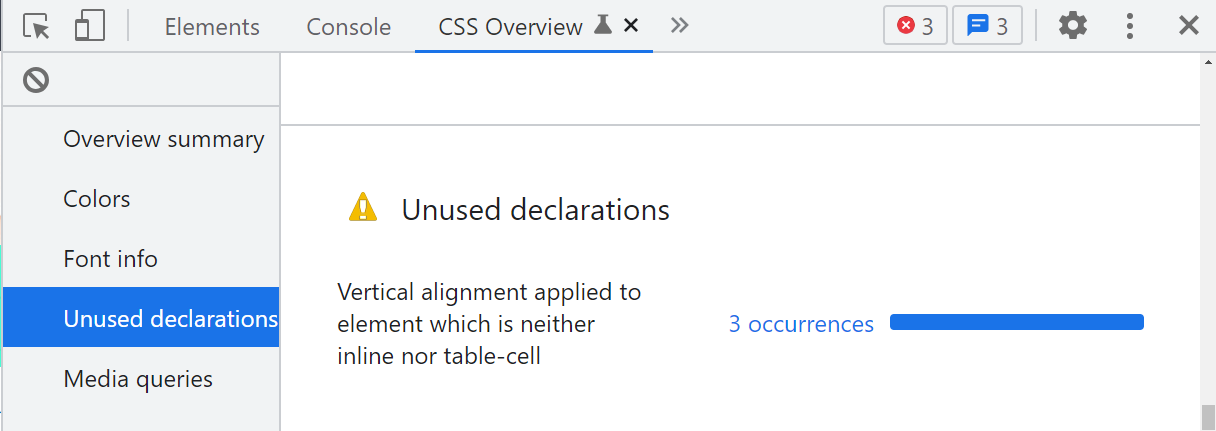 An illustration of the unused declaration panel.
The image above shows the number of unused declarations on the web page. The vertical alignment applied to the element that isn't inline or a table cell will not affect the page.
You can also click on the occurrences to see a list of elements affected, like the font info and color panel.
Media Queries
The media query panel displays a list of all the media queries used in creating the web page. You will be able to examine the various widths and screen resolutions used in creating the web page.
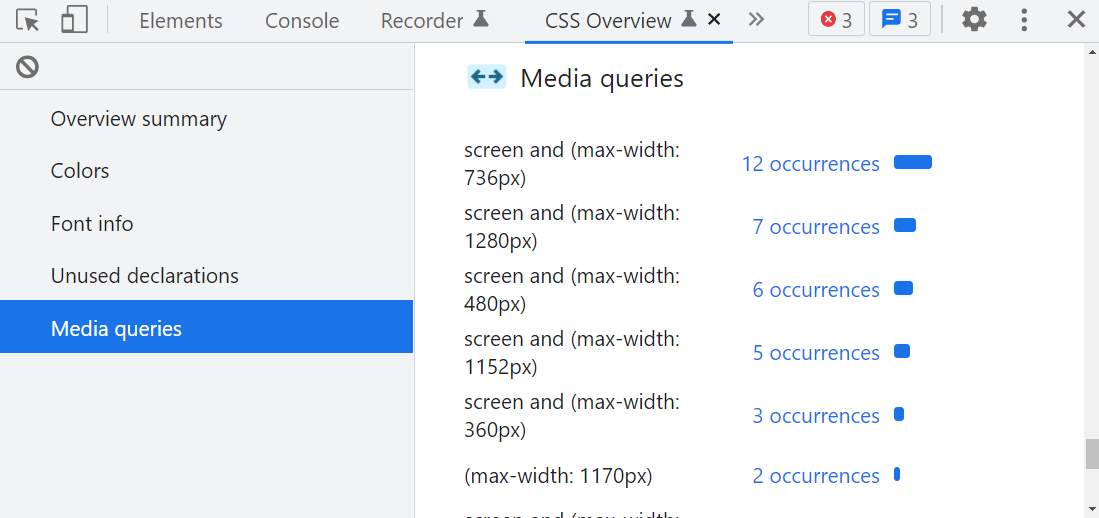 An illustration of the media query panel.
The above example displays the number of media queries used in creating the web page. It lists the screen resolutions used in order of occurrence, from highest to lowest. If you click on the occurrences, you will see a list of the affected elements.
Conclusion
When it comes to evaluating CSS attributes on a web page, the CSS overview tool comes in handy. It allows front-end developers and designers to inspect the CSS properties on a web page.
Thank you for reading 💙. If you would like to chat or have any questions, please feel free to contact me anytime on Twitter: @cessss_ and linkedIn: Success.
Also, follow my blog to read some of my other stuff @cesscode.
Happy coding! 💙