
By Faith Oyama
Pandas is a fast and approachable open-source library in Python built for analyzing and manipulating data.
This library has a lot of functions and methods to expedite the data analysis process. One of my favorites is the groupby method, mainly because it lets you get quick insights into your data by transforming, aggregating, and splitting data into various categories.
In this article, you will learn about the Pandas groupby function, how to aggregate data, and group Pandas DataFrames with multiple columns using the groupby method.
What do I need to install on my computer to follow this article?
For this article, I'll be using a Jupyter notebook. You can install Jupyter notebook and get it up and running on your computer via the official website.
After installing Juypter, create a new notebook and run Import pandas as pd to import pandas and Import numpy as np to import NumPy.
NumPy will let us work with multi-dimensional arrays and high-level mathematical functions. On the other hand, Pandas will allow us to manipulate our data and access the df.groupby(), the groupby method.
Let's get started.
What is groupby in Pandas?
If you're familiar with SQL and its GROUP BY syntax, you already know how powerful it is in summarizing and categorizing data.
The Pandas groupby method in Python does the same thing and is great when splitting and categorizing data into groups to analyze your data better.
Here is the syntax for Pandas groupby:
python DataFrame.groupby(by=None, axis=0, level=None, as_index=True, sort=True, group_keys=_NoDefault.no_default, squeeze=_NoDefault.no_default, observed=False, dropna=True)
Each attribute has a meaning:
by– List of the columns you want to group by.axis– Defaults to 0. It takes 0 or 'index', 1 or 'columns'.level– Used with MultiIndex.as_index– SQL style grouped otput.sort– Defaults to True. Specify whether to sort after grouping.group_keys– add group keys or not.squeeze– deprecated in new versions.observed– Only use if any of the groupers are Categoricals.dropna– Defaults to False. Use True to drop None/Nan.
Now let's see how this function works in action.
How to Load the Dataset
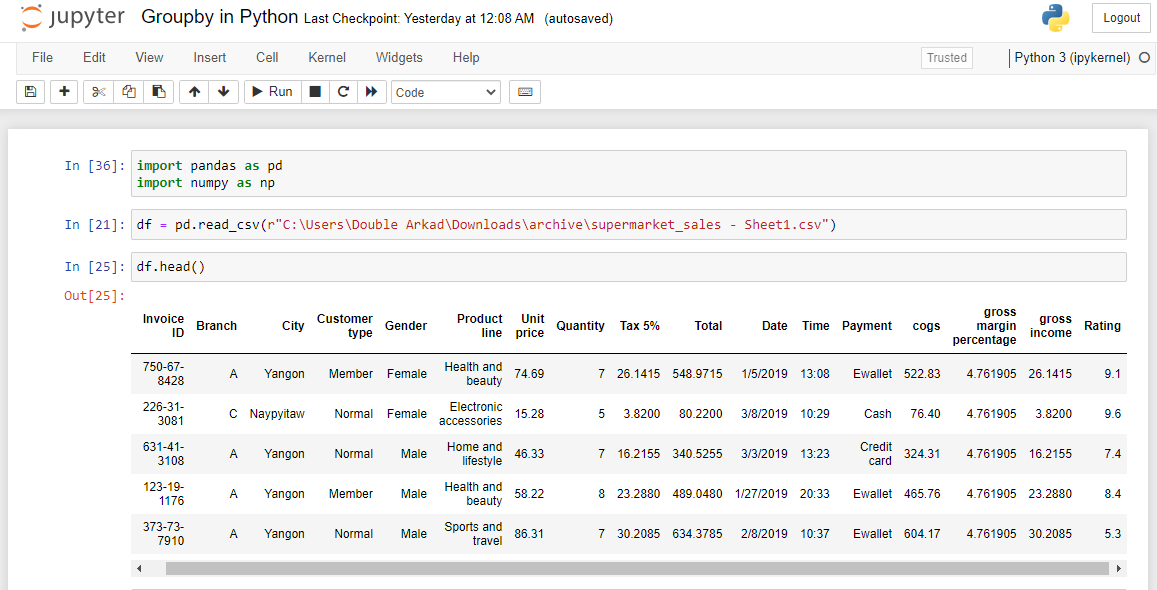
For this tutorial, we'll use the supermarket sales dataset from Kaggle, which you can access and download here.
After downloading the dataset, load the data into a pandas dataframe.
A DataFrame is a 2-dimensional data structure made up of rows and columns. This is very similar to your spreadsheet.
You can do that by running this code:
df = pd.read_csv(r"C:\Users\Double Arkad\Downloads\archive\supermarket_sales - Sheet1.csv")
After that, use the df.head() method to show the first few rows of your dataset. After running df.head(), you should get the result below. This indicates that the dataset got loaded successfully.
How to Use the groupby Method in Pandas
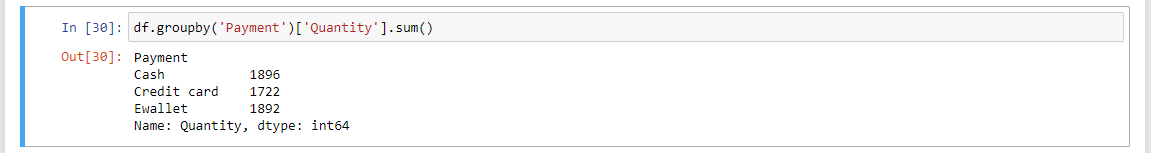
Assume your employer asked you to total the number of items ordered and categorize them according to the different payment options. This will let you determine which payment method generates the most revenue.
You can answer this question with the groupby function by simply grouping the data based on the 'Payment'.
df.groupby('Payment')['Quantity'].sum()
sum function with groupby
The first column, 'Payments', is the column you want to group by. The second column, 'Quantity' is the column you'll perform an aggregate function on. Lastly, you have the aggregate function .sum().
The Sum() is one of many functions you can use in a groupby. You could also use other aggregate functions like the Min(), Mean(), Median(), Count(), and Average() to find the minimum, mean, median, count, and average value in a group within your dataset.
But by using the agg() function, you can perform two or more aggregations simultaneously.
Let's see how that works.
How to Aggregate Data Using groupby in Pandas
Pandas groupby and Agg()
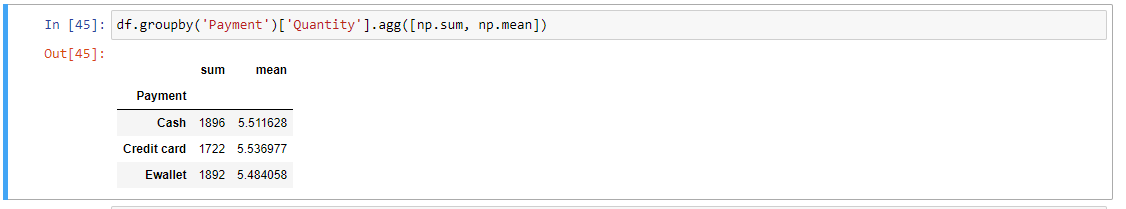
Here's how to use agg() in a groupby function to find this supermarket's most used payment method.
df.groupby('Payment')['Quantity'].agg([np.sum, np.mean])
agg function with groupby
There are more cash transactions done. Ewallets and credit card transactions follow in level of use.
Notice here we created a dictionary and passed the aggregate functions to be performed. This simultaneously performed two statistical computations on our data! Of course, you can add more aggregate functions in the dictionary depending on the insights you want to get.
Here is what I mean:
df.groupby(['Payment', 'Customer type'])['Quantity'].agg([np.sum, np.mean, np.max, np.min])
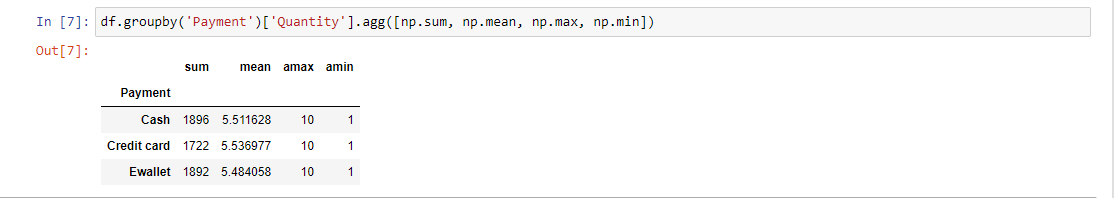
In the groupby function, we added more aggregate functions to our statistical computation to gain insight into the maximum and the minimum number of goods ordered in each payment group.
Pandas groupby and count()
Here's how it works:
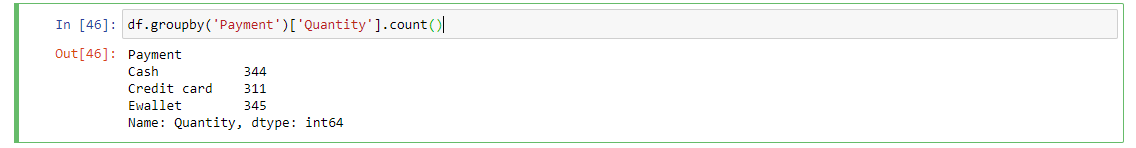
df.groupby('Payment')['Quantity'].count()
And here's the result you get:
count function with groupby
From the output, we're counting the total number of orders placed in the store and grouping the results by each payment method.
How to Group Pandas DataFrames by Multiple Columns
You can also group multiple columns in the groupby function. For example, we included a column below to our groupby function called 'Customer type'.
df.groupby(['Payment', 'Customer type'])['Quantity'].sum()
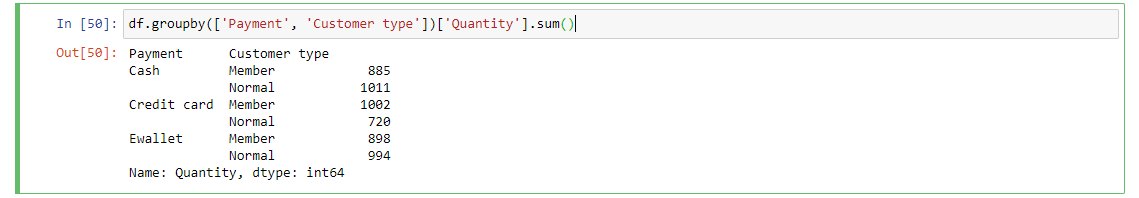
Our output shows that the data was split and categorized into two groups based on the Customer type column. The output is becoming easier to analyze.
How to Aggregate Multiple Columns Using Pandas groupby
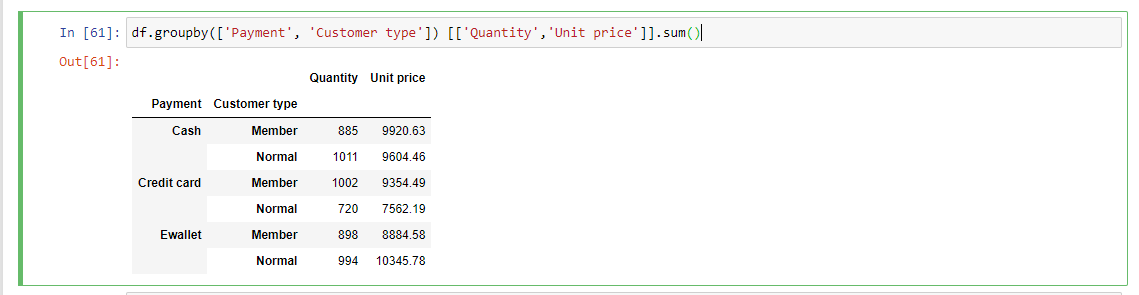
You can also perform statistical computations on multiple columns with the groupby function. For example, let's look at the total sales generated and quantity ordered and group our results by the "Payment" and "Customer type" columns.
Run the code:
df.groupby(['Payment', 'Customer type']) [['Quantity','Unit price']].sum()
sum function with multiple columns grouping
We can see from the output that the Payment type "Ewallet" generated the most revenue, and you can move on to determine which type of Customers contributed the most revenue for the Store.
Summary
In this article, you learned about the importance of the Pandas groupby method. You saw how the groupby function allows you to do a lot of operations on your data, from splitting the data to applying a function like Sum() to get more insight and add more functionality.
To learn more about Python and how you can use it for data analysis, I'll recommend this Python for data analysis course on the freeCodeCamp YouTube channel.
If you enjoyed reading this article and/or have questions and want to connect, you can find me on LinkedIn or Twitter.