
As web developers, it often feels like we spend more time fixing bugs and trying to solve problems than we do writing code. In this guide we'll look at some common debugging techniques, so let's get stuck in.
"Fail to prepare, prepare to fail"
What better way to start an article than with an old cliche! Bug's and issues are going to pop up. There is simply no way of getting away from this (sorry). With some simple planning, there are ways in which we can minimize the complexity and number of problems we face.
Break the task up into smaller tasks
Now, I get it, we all like to get very excited and dive straight into our coding projects. The thing is, without some sort of plan we are creating problems for ourselves before we even start!
If I said to you, "you have to build a shopping list app", and you started coding straight away, what would happen? You would end up staring at a blinking cursor wondering how or what to do first, cursing my name under your breath for asking you to do such a task.
It's always easier to take a large problem and break it up into many smaller problems. For example, we can break the shopping list project into smaller tasks:
- Create a form to add an item to the list
- Allow a user to remove an item from the list
- Display a total number of items in the list
You can even break these tasks up into more detailed tasks. For example, for the first task in our list, our first, "little mini task" (should I trademark that term?) could be:
1) Create an input field to capture the item name
2) Create a button that calls a functions addToList() when clicked
3) Write logic within the addToList() function that adds the item to the list
And so on. You get the idea. I prefer breaking work up like this as it really makes me think about the problems I'll encounter early and the solutions (I've written an in-depth article about this here) before I've written any code. It also helps me understand what I'm trying to do, and puts me in the "zone". It's much easier to solve problems that arise when you understand what you are trying to achieve.
Be prepared to purge your code
To make an omelet, we have to break a few eggs. This means being prepared to completely re-write our code to get it working.
I bet you're thinking, "oh man, it took me days/weeks/millennia to get this far with my code, and now I have to delete it?!" Um, yeah. Sometimes. Sorry. The reality with web development is that code will change all the time, for various reasons - bugs, code reviews, changes in requirements, boredom, etc.
Sometimes we feel so precious about our code and can't bear to delete it, that we try and overcome problems by trying to "fit a round peg into a square hole". We think "NOO! I can't possibly delete this method. It took me forever. There has got to be a way!" This mental block causes our own problems - because by simply rewriting what we currently have, we could find the solution to our problems.
Now that we're nice and prepared, let's look at what happens when things do go wrong.
Error messages are good
What's worse than seeing an error message when something goes wrong? Not seeing any error message when something goes wrong. Even though it's a daunting feeling to see a big red stack trace when we run our carefully crafted code, error messages are there to say "yeah, things are messed up right now, but here are some places you can look to start fixing it".
If we have a look at this example:
let animals;

function addAnimal(){
    animals.push('elephant');
}

addAnimal();
Now let's have a look at the error:
TypeError: Cannot read property 'push' of undefined
at addAnimal (https://vanilla.csb.app/src/index.js:8:11)
at evaluate (https://vanilla.csb.app/src/index.js:11:1)
at $n (https://codesandbox.io/static/js/sandbox.acff3316.js:1:148704)
I've left out some of the stack trace as most of it is, well, gibberish. Depending on how your frontend project handles error messages, you may even see the error in your browser:
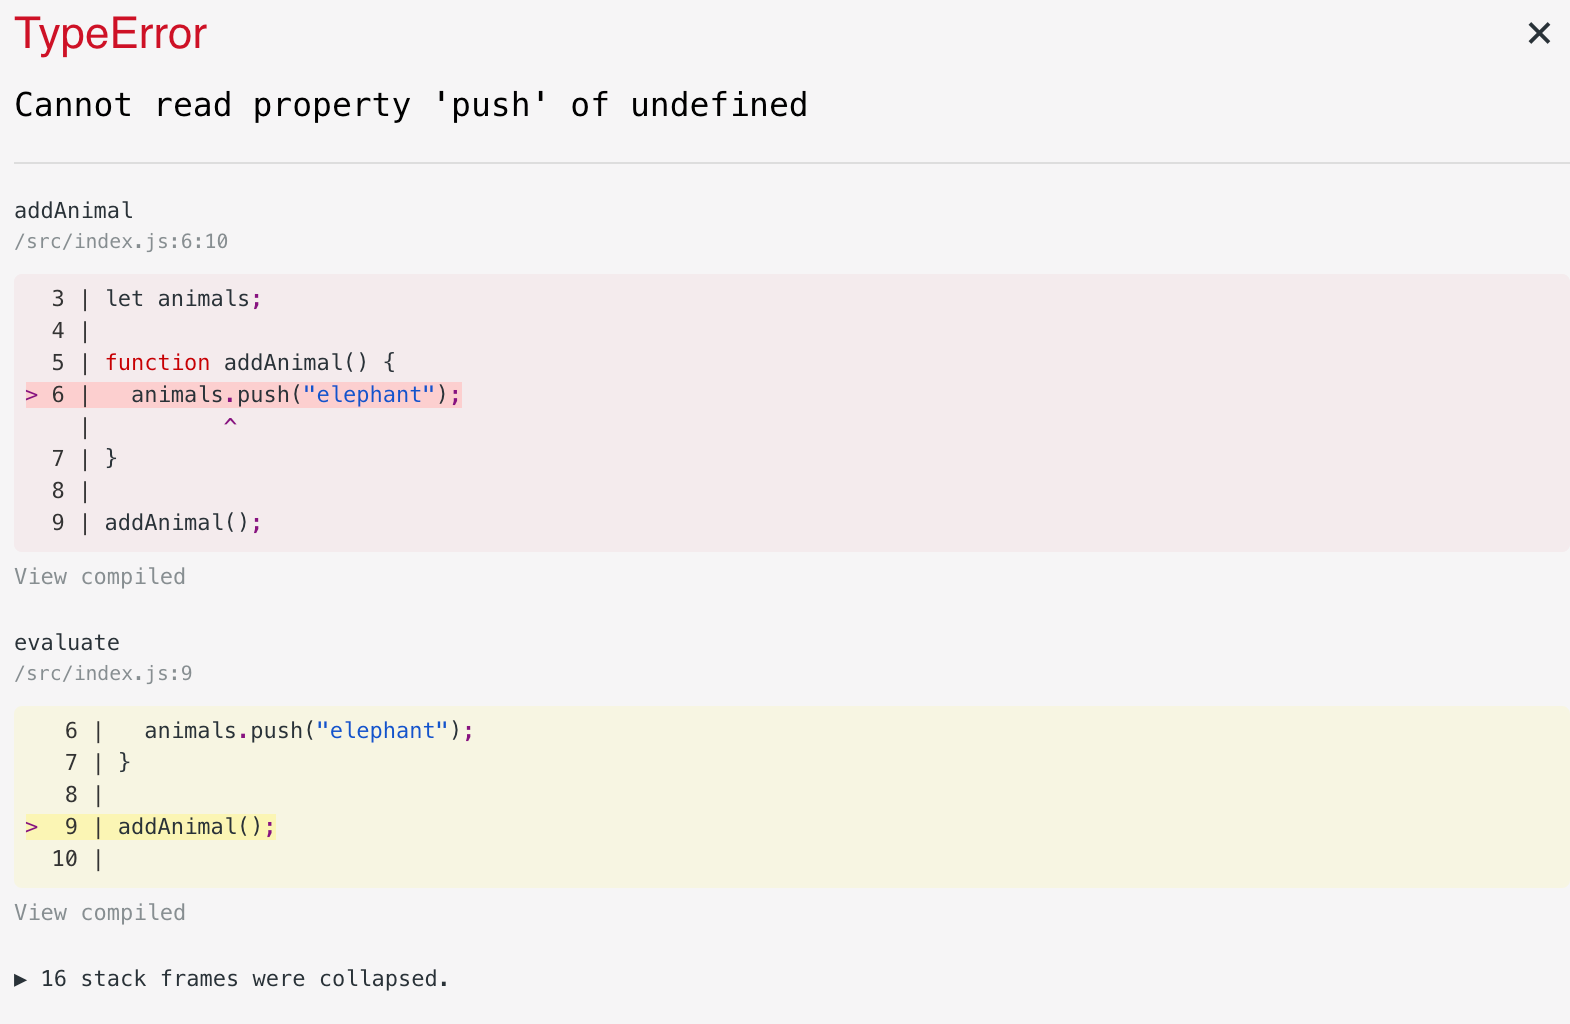 Look at that beauty of an error!
The important parts of the stack trace are usually at the top - the message, the function, and the line number, and our browser shows us this as well. So the interpreter does it's best to tell us what's wrong. It's a shame it can't solve the problem for us, eh?
So, we've finished having our panic attack at seeing the error and have picked some information from the error message. If we break it down we can see this line:
Cannot read property 'push' of undefined
This usually means that there is a variable not defined or initialized somewhere. BUT WHERE?!?
If we continue reading the stack trace, we see the error occurs within the addAnimal() function. We can see that we are trying to push a new animal to an array - ah! I forgot to initialize the animals array. Doh! Our fixed code looks like this:
let animals = [];

function addAnimal() {
    animals.push("elephant");
}

addAnimal();
The error thrown in the browser will show you the problem quicker, but not all frontend projects will be configured to do this, and backend developers do not have this luxury. This is why I recommend learning to read the stack trace.
To defeat the bug, you must think like the bug
The stack trace gives you an idea of what the error is. Well, sometimes it does and sometimes it doesn't. What if you see an error message that looks more like cave glyphs than English? Or what if there is no error, but your code is simply not acting as you thought?
It's time to get the debugger out. Let's walk through another example. But first some context!
Mr. Bob CEO (who is a CEO, who would have thought?!) approaches you and says,
"Hey, I have an amazing idea for a product.
- I want a web app that allows the user to enter a number.
- If the number is less than 5, the message should read "UNDER".
- If the number is equal to or more than 5, the message should read "OVER".
This is a million-dollar idea and I want you to build it for me".
"OKAY!" You say, and you get to work.
Coding montage with dramatic music plays as time fast forwards
You've completed the code for your web app. Huzzah!
<!doctype html>

<html lang="en">
<head>
  <meta charset="utf-8">

  <title>My super awesome number app</title>
  <meta name="description" content="The HTML5 Herald">
  <meta name="author" content="SitePoint">

</head>

<body>
    <input id="number-input"></input> <button id="number-input-submit-button">Submit</button>
    <div id="number-display">0</div>
    <script src="./index.js" type="text/javascript"></script>
</body>
</html>
(function () {
    const numberInputSubmitButton = document.getElementById("number-input-submit-button")

    numberInputSubmitButton.addEventListener("click", function () {

        const numberInputValue = document.getElementById("number-input").value;

        let text;
        if(numberInputValue > 5) {
            text = "OVER";
        } else {
            text = "UNDER";
        }

        document.getElementById("number-display").innerHTML = text
    });
})();
(Note: You may have spotted the bug already. If you did, let's pretend you didn't. If you haven't noticed the bug, that's OK.)
Time to start testing. Let's run through some use cases for our business logic.
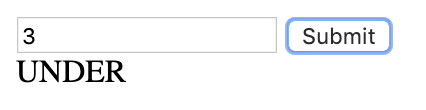
1) User enters 3:
2) User enters 7
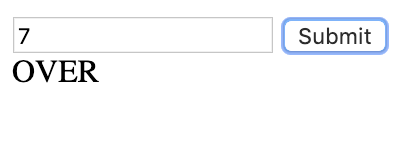
So far so good! But what happens if we enter 5?
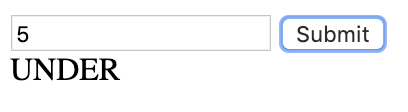
OH NO! A bug! The text displayed is incorrect, it should display "OVER" but instead displays "UNDER". Hmm, no error messages, and I can't seem to see in the code what is wrong. Let's run the debugger and step through the code.
Using the debugger
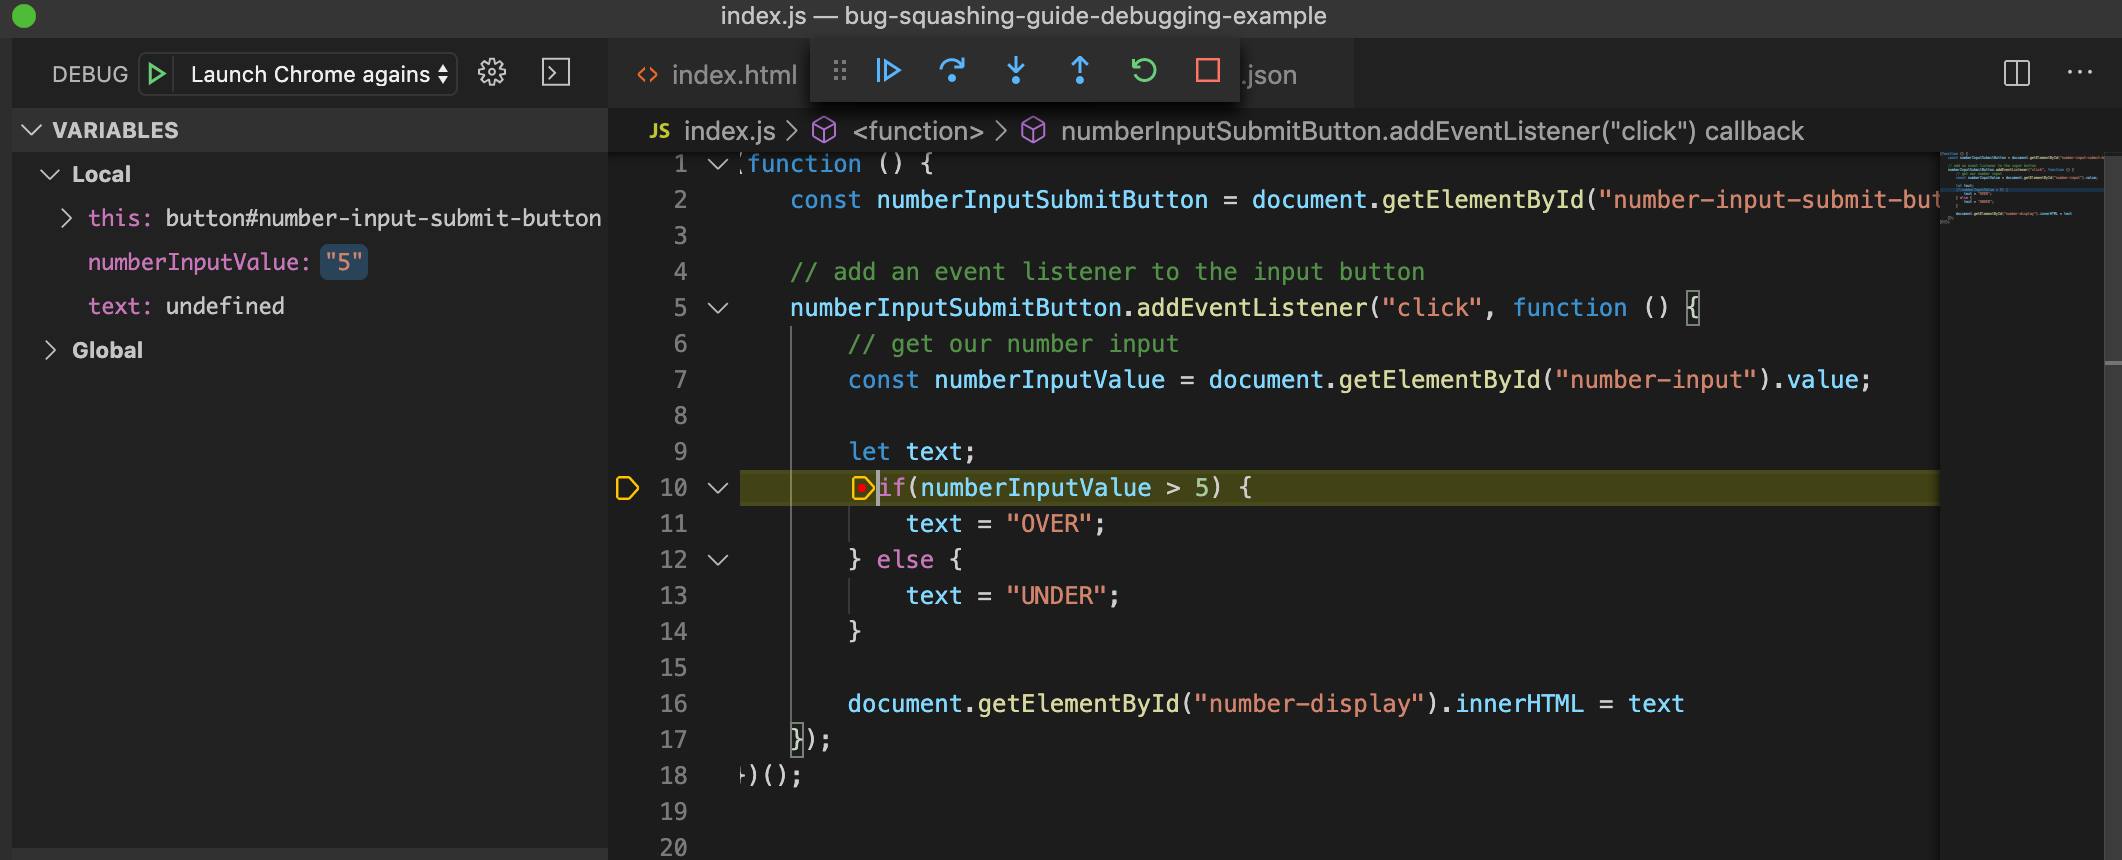 Note the "variables" panel on the left - this can be a life saver
A good place to start is to put a breakpoint as close to the buggy code as possible. You can determine this by reading the code, error messages, or if you have that "ah-ha! I know which method is causing this" moment. From here, it's a case of stepping through the code, inspecting the variables, and checking if the correct code branches are run.
In our example, I have put a breakpoint at the start of my if statement - as this is where the failing logic is.
Once I start debugging, chrome opens and I can replicate the issue by entering "5" and clicking submit. This hits the breakpoint, and immediately there are a few things to note:
- The debugger stops at the breakpoint, so this means I'm on the right track
- This also means that the function is being called correctly, and event handlers are working as expected
- I can also see that the user input is being captured correctly (from the "variables" panel on the left-hand side, I can see that "5" was entered)
So far so good, no immediate issues to worry about. Well, code related ones anyway. Next, I'll press F10 to step through the code. This runs each statement individually, allowing us to inspect elements, variables, and other things at our own pace. Isn't technology just fabulous?
Remember since I expect the message "OVER" to appear when the user enters "5", I'm expecting the debugger to take me into the first branch of the if statement...
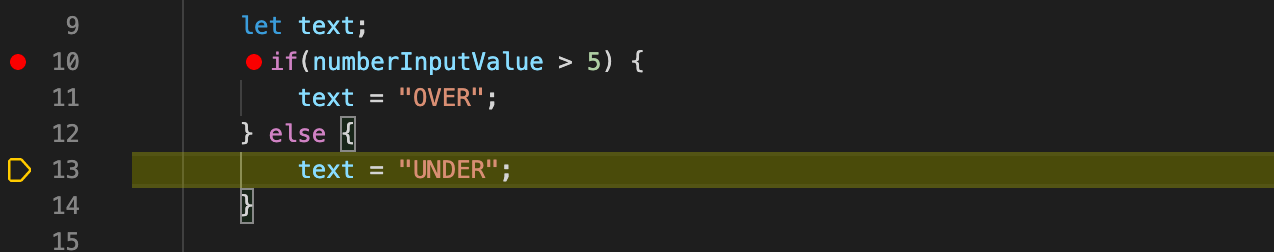
BUT NO! I'm brought into the second branch. Why? I need to amend the conditional to read "more than or equals to" as opposed to "more than".
if(numberInputValue >= 5) {
    text = "OVER";
} else {
    text = "UNDER";
}
Success! Our bug is fixed. Hopefully this gives you an idea on how to walk through the code, making use of VSCodes awesome debugging tools.
More Debugging tips
- If your breakpoints aren't being hit, this could be part of the issue. Make sure the correct functions or event handlers are being called in the way you expect
- You can
step overfunctions you want to skip. If you want to debug any functions you come across, use thestep intocommand - Watch out for variables, parameters, and arguments as you are stepping through your code. Are the values what you expect?
- Write code in a way that is easier to read/debug. It might look cool to have your code on one line, but it makes debugging harder
Google is your friend
Ok so we've looked at the stack-trace, tried debugging, and we're still stuck with this bug. The only thing left to do now is make a sacrifice to the coding gods and hope things fix themselves!
Or I guess we could use Google.
Google is a treasure trove of software development problems and solutions, all at our fingertips. It can be sneakily difficult to access this information though, as you have to know how to Google the right things to get the right information! So how do we effectively use Google?
Let's look back to our first example - you've read the stack trace, looked at the code, but the message Cannot read property 'push' of undefined is still driving you mad. Bewildered, you take to Google in hopes of finding an answer. Here are some things to try:
Copy and paste the error message. Sometimes this works, depending on how "generic" the error message is. For example, if you get a Null pointer exception (who doesn't love those?), Googling "Null pointer exception" might not return very helpful results.
Search for what you are trying to do. For example, "How to create an array and add an item to the end". You might find some generous developer has posted a solution using best practices on StackOverflow, for example. You might also find this solution is completely different from yours - remember what I said about being comfortable purging your code?
A side note on using someone else's code - try and avoid blindly copying and pasting, make sure you understand what the code does first!
Ask for help the right way
Hopefully, after a mix of debugging, stack trace investigating, and Googling you have seen the light at the end of the tunnel and solved your problem. Unfortunately, depending on what you are trying to do, you still might be a bit stumped. This is a good time to seek advice from other people.
Now, before you run into the street screaming "my code is broken please help me!", it's important to know the best way to ask for help. Asking for help in the right way makes it easier for people to understand the problem and help you solve it. Let's look at some examples:
Bad - "My code is broken and I don't know what's wrong."
Good - "I'm trying to add an item to the end of an array in JavaScript, and I'm getting this error message: Cannot read property 'push' of undefined. Here's my code so far."
See how the "Good" example is much more informative? More information makes it easier for other kindhearted devs to help you out. This is a good habit to get into as it not only benefits you when you are learning to code but also in your first job when you need to ask for help.
So where can you ask for help?
- StackOverflow
- Slack groups
- Colleagues or developer friends
Quick Tip: You can use a tool like CodeSandbox.io or CodePen.io to recreate your problem and share it with people.
Practice, practice, practice
Just like Rome wasn't built in a day (well, it could have been for all I know) you will not become king bug squasher overnight. As your career goes on and your experience grows, you'll be armed with a wealth of knowledge that helps you solve bugs and issues faster. I regularly find myself saying "ah, I've solved that before" or "oh yeah, I have a StackOverflow link that helps me here" and the whole thing becomes a lot easier. So keep practicing, and this skill will grow naturally.
Thanks for reading! If you enjoyed this article, why not subscribe to my newsletter?
Every week I send out a list of 10 things I think are worth sharing — my latest articles, tutorials, tips and interesting links for upcoming developers like you. I also give out some free stuff from time to time :)