
Hello and welcome to the world of data analysis! If you're considering a career in this field, you're in good company. Data analysis is a growing and exciting field that's becoming increasingly important in today's data-driven world.
Let's face it, we're all drowning in data these days. From social media posts to financial transactions to medical records, there's no shortage of information to sift through.
That's where data analysts come in. They're the ones who help us make sense of all that data and turn it into valuable insights.
And those insights can be game-changing. They can help businesses improve their products and services, governments make more informed policy decisions, and individuals make better choices in their personal and professional lives.
But it's not just about the impact. Data analysis can also be quite lucrative. According to recent studies, the median salary for a data analyst in the US is around $70,000 per year, and that number can climb even higher with experience and expertise.
Of course, like any profession, data analysis has its challenges. There's the occasional headache-inducing data set, the ever-present threat of imposter syndrome, and the endless debates over the best programming language or data visualization tool. But hey, if you're up for a challenge, this could be the field for you.
So if you're trying to be a Data Analyst, this article is for you. Hopefully, it saves you a lot of time and effort and you don't have to waste your time learning a whole lot of irrelevant things like I once did.

Step 1: Get to Know the Role of a Data Analyst
Are you considering a career as a data analyst? That's fantastic! Let's take a moment to grasp the gist of it before moving forward.
You see, a data analyst's job involves more than just crunching figures and creating charts (although those things can be pretty cool, too). It involves leveraging data to find insights and address issues. This means coming up with the correct questions, organizing and evaluating the data, and explaining your conclusions to others.
Some core skills and activities that a data analyst typically performs include:
Collecting and analyzing large data sets to identify patterns, trends, and insights that can inform business decisions.
Using statistical tools and techniques to draw insights from data.
Developing and implementing data collection systems and other strategies that optimize efficiency and data quality.
Collaborating with other teams to identify business needs and develop data solutions that address them.
Communicating findings and insights to stakeholders in a clear and actionable way.
So if you're not a math prodigy or a computer whiz, don't worry. Statistics, computer science, and business are just a few of the numerous disciplines that are incorporated into the multidisciplinary topic of data analysis. Everyone who enjoys learning, solving problems, and making a difference can really enjoy it.
So how can you find out more about what a data analyst does? You can start by looking through the numerous free resources that are accessible online. For example, here an article that discusses what data analysts actually do. And here's one that discusses data analyst vs data science roles.
Many blogs, podcasts, and YouTube channels offer entertaining and informative content on the subject of data analysis. I will be dropping some YouTube channels that have helped me over the years below.
To gain a feel of the skills and qualities needed, you can also network with other data analysts, go to meetings or seminars, and study job descriptions.
Don't forget to consider whether dealing with data is something you enjoy. Do you enjoy finding patterns and solving puzzles? Do you want to change the world for the better? Data analysis may be the ideal career choice for you if the answer is yes.
The first step in your path is to understand what a data analyst does. Enjoy yourself, take your time, and don't be hesitant to ask questions.
Step 2: Explore Job Requirements for Data Analyst Roles
Now that you have a better understanding of the role of a data analyst, it's time to start looking at what employers are looking for. After all, you want to make sure that your skills and knowledge match up with what's required in the job market.
But before you start panicking about not having enough experience, remember that every company is different. Some may prioritize programming skills, while others may value communication and business acumen. That's why it's important to do your research and find out what specific skills and qualifications are most in demand in your desired industry or company.
So how do you go about finding this information? Well, one great place to start is by checking out job listings and descriptions on job boards like LinkedIn, Indeed, or Glassdoor. This can give you a good sense of the key requirements and qualifications for different data analyst roles.
Some examples of what job listings might ask for include:
Proficiency in SQL and experience working with large datasets
Familiarity with Python and data visualization tools like Tableau or Power BI
Strong analytical skills and the ability to draw insights from complex data
Experience with statistical analysis and modeling techniques
Excellent communication skills and the ability to explain complex findings to both technical and non-technical audiences
But don't stop there! You can also reach out to people who work in the field or who have job titles that interest you. Ask them about their experience and what skills they think are most important for success in their role. You might even want to consider setting up informational interviews to learn more about the field and get advice on how to get started.
And speaking of getting started, it's important to remember that there's no substitute for hands-on experience. As tempting as it may be to spend all your time watching tutorials, you'll learn much more quickly and effectively by actually building things and working on real data analysis projects.
So take some time to explore job requirements, but don't forget to keep building your skills and gaining practical experience. With a little effort and a lot of curiosity, you'll be well on your way to becoming a successful data analyst.
Step 3: Get Comfortable with Math and Statistics
Okay, I know what you're thinking. Math and statistics? Yikes!

But hear me out before you run for the hills. For a data analyst to be able to make sense of data and derive valuable insights from it, having a fundamental understanding of these concepts is essential.
So what fundamental statistical concepts and formulas should you be familiar with?
Now, to start, there are measures of central tendency known as mean, median, and mode, which can give you an idea of the typical value in a dataset. You should know how to calculate them.
The standard deviation is a measure of how widely distributed the data are from the average, and you should be able to calculate it.
And in order to find relationships between variables and generate predictions based on those associations, you should also be familiar with correlation and regression.
But it's not just about numbers. You'll also need a rudimentary understanding of linear algebra, which is employed in many data analysis approaches. Here's an in-depth course (and textbook) to get you started.
You may need to employ matrices to modify and manipulate data, or you may need to use linear regression to forecast future values based on historical trends.
If you don't have a solid math background, this may seem difficult. But don't be concerned! There are numerous resources available to assist you in your learning.
For example, Khan Academy offers lessons and practice tasks in math and statistics. If you prefer books, "Data Science for Beginners" by Andrew Park is an excellent resource that covers both statistical and mathematical principles in an accessible manner.
freeCodeCamp is developing a math curriculum which you can read about here.
And here's a guide on the statistics you need to know to get into data science and pursue fields like Machine Learning.
The key is to start small and build up your knowledge gradually. Don't be afraid to ask questions or seek help when you need it. With a little practice and persistence, you'll soon find that math and statistics are actually kind of fun (no, seriously!).

Step 4: Master Excel for Data Analysis
Excel is a vital tool in a data analyst's arsenal. It's used by virtually every organization out there, and mastering it will help you clean, manipulate, and analyze data with ease.
With Excel, you can create formulas and functions to perform calculations, pivot tables and charts to visualize data, and use data analysis tools to make predictions and identify patterns. Excel is particularly useful for regression analysis, forecasting, and scenario analysis.
If you're serious about becoming a data analyst, it's essential to master Excel. Fortunately, there are plenty of online resources available to help you learn. Check out ExcelIsFun, Excel Chandoo, Tutorials Point, Ashutosh Kumar , and MyOnlineTrainingHub for tutorials on Youtube. Also, the following courses will guide you on how to get the most out of Excel.
Introduction to Data Analysis Using Excel by Coursera
Data Analysis with Python for Excel Users on freeCodeCamp's YouTube channel
Excel Skills for Business Specialization by Coursera
Remember, Excel is just one tool in your data analysis toolkit. But it's a crucial one that you'll use daily as a data analyst. By mastering Excel, you'll be well-equipped to handle any data-related task that comes your way.
Now let's move on to the next skill and also one of the most important skills you'll need as a data analyst.
Step 5: Master SQL for Data Extraction
SQL (Structured Query Language) is a critical tool in data analysis. As a data analyst, one of your primary responsibilities is to extract data from databases, and SQL is the language used to do so.
SQL is more than just running basic queries like SELECT, FROM, and WHERE. It's a complex language that allows you to manipulate and transform data in countless ways. SQL is used for joining data from multiple tables, filtering and aggregating data, and creating new tables and views.
To be an effective data analyst, it's essential to master SQL. You should be comfortable with writing queries, creating tables, and understanding how to optimize your queries for performance.
Fortunately, there are many resources available to help you learn SQL. Some great places to start are Khan Academy SQL, W3Schools, SQLZoo, SQLbolt, Luke Barousse, Alex the Analyst, Microsoft Power Tools, and finally some SQL games like SQL island and SQL Murder.
Additionally, there are many online courses and books available that cover SQL in-depth. Here are a few to get you started:
By mastering SQL, you'll be able to extract valuable insights from databases and manipulate data in ways that provide meaningful business insights.
Step 6: Learn Python for Data Analysis
I know there's a lot of speculation as to whether or not a data analyst needs Python – some say they do while some say they don't.
For me, I'd like to say it depends on the company you're working for – but it's nice to have an edge by learning Python as it's one of the most widely used programming languages in the world of data analysis. Python is known for its simplicity, readability, and versatility, making it a popular choice for data analysts.
Python has a vast array of libraries and tools that can make data analysis easier, such as Pandas for data manipulation and analysis, NumPy for scientific computing, and Matplotlib for data visualization. It also has the ability to automate tasks, making data analysis more efficient and effective.
Learning Python for data analysis is a great investment in your career as a data analyst. Not only will it allow you to work with powerful libraries, but it will also open up many opportunities to work with larger datasets and more complex analyses.
There are many resources available to help you learn Python, from free online courses to paid online programs and textbooks. Some resources include freeCodeCamp, DataCamp, CodeBasis, Programming with Mosh and Microsoft Learn.
By learning Python, you'll be able to perform more complex data analysis, automate tasks, and work with a broader range of datasets, making you a valuable asset in any data-focused organization.
Step 7: Master a Data Visualization Tool
As a data analyst, it's essential to be able to communicate your findings in a clear and concise manner. One way to do this is through data visualization. Data visualization tools like PowerBI and Tableau can help you create interactive charts, graphs, and dashboards that make it easy for others to understand your findings. We'll talk about them more in a minute.
Here's a Tableau for Data Science and Data Visualization course you can check out.
While SQL is great for querying and manipulating data, it can't fully bring your data to life. This is where a data visualization tool comes in. These tools allow you to transform your data into insightful and easy-to-understand visualizations that can be shared with stakeholders.
You can learn data visualization basics in this in-depth free course on freeCodeCamp's YouTube channel.
PowerBI is a great choice for data visualization as it is easy to learn and integrate with other Microsoft products. This makes it an ideal tool for organizations that use Microsoft Office. Tableau is also a popular choice and has a strong community of users and a wide range of features.
Learning a data visualization tool like PowerBI or Tableau will enable you to create compelling visualizations that help you better understand your data and communicate your findings to others. There are many online courses and tutorials available to help you learn these tools, such as the official Microsoft PowerBI training and Tableau's own training courses.
By mastering a data visualization tool, you'll be able to create interactive and engaging visualizations that will help you better understand your data and communicate your findings to others, making you an invaluable asset to any data-focused organization.
You can also dive into other popular data viz tools like D3.js - here's a course on it to get you started.
Step 8: Network with Other Data Analysts and Developers
Networking is an essential part of any profession, and data analytics is no exception. By networking with other data analysts and developers, you can learn from their experiences, get insights on the latest industry trends and technologies, and potentially find job opportunities.
Here are a few ways to network with others in the field:
Attend industry events: Look for conferences, meetups, and other events related to data analytics and attend them. This is a great way to meet others in the field and learn about new developments and technologies.
Join online communities: There are many online communities for data analysts and developers, such as forums, LinkedIn groups, and social media groups. Join these communities and participate in discussions to connect with others in the field.
Reach out to others: Don't be afraid to reach out to other data analysts and developers, whether through social media, email, or in person. Introduce yourself, ask for advice, and build relationships.
Remember, networking is a two-way street. Be willing to offer help and advice to others in the field as well. By building a strong network of contacts in the data analytics field, you can enhance your career opportunities and stay up to date on the latest industry trends and technologies.
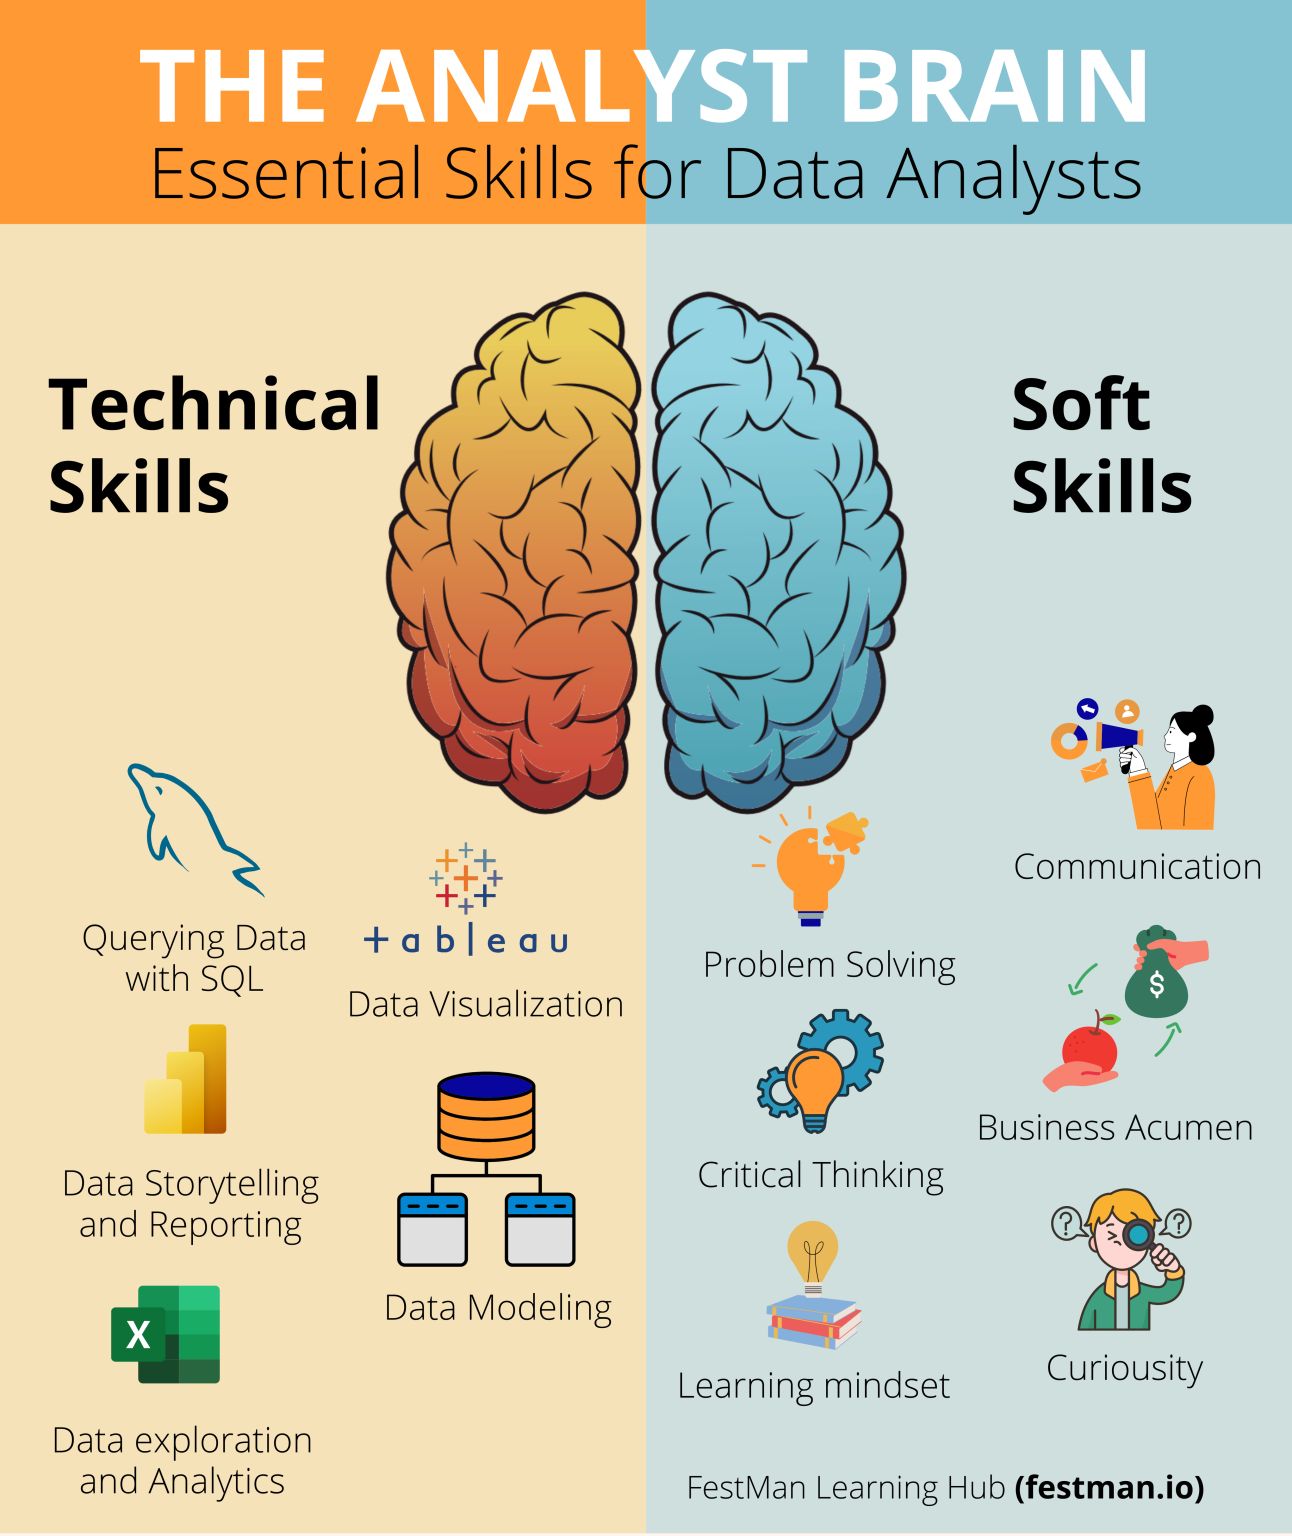
Step 9: Don't Forget about "Soft Skills"
One final skill that I think needs to be worked on before you can be a great DA is your soft skills which involves your ability to communicate, solve problems etc
After all is said and done, practice and practice and build projects.
Conclusion.
Becoming a data analyst requires dedication, hard work, and a passion for data analysis. Following the steps outlined in this roadmap will help you gain the necessary skills and knowledge to become a successful data analyst.
From understanding the role of a data analyst, to mastering SQL and Python, to networking with other developers, each step is crucial to achieving success in this field.
Remember to stay curious, never stop learning, and always be willing to adapt to new technologies and methodologies. With determination and persistence, you can achieve your goal of becoming a proficient data analyst and unlock a world of exciting career opportunities.