Menu
Menu
Forum
Curriculum
Donate
#CHARTS
A collection of 15 posts
#General Programming
| 2773
#tech
| 2735
#JavaScript
| 2529
#Web Development
| 2034
#technology
| 1718
#Python
| 1011
#React
| 970
#youtube
| 951
#startup
| 715
#software development
| 673
#Design
| 577
#Productivity
| 543
#Life lessons
| 532
#CSS
| 491
#self-improvement
| 486
#React
How to Build an Interactive University Ranking System Using React and Data Viz Tools
##data visualisation
How to Use Chart js for Interactive Data Visualization
#charts
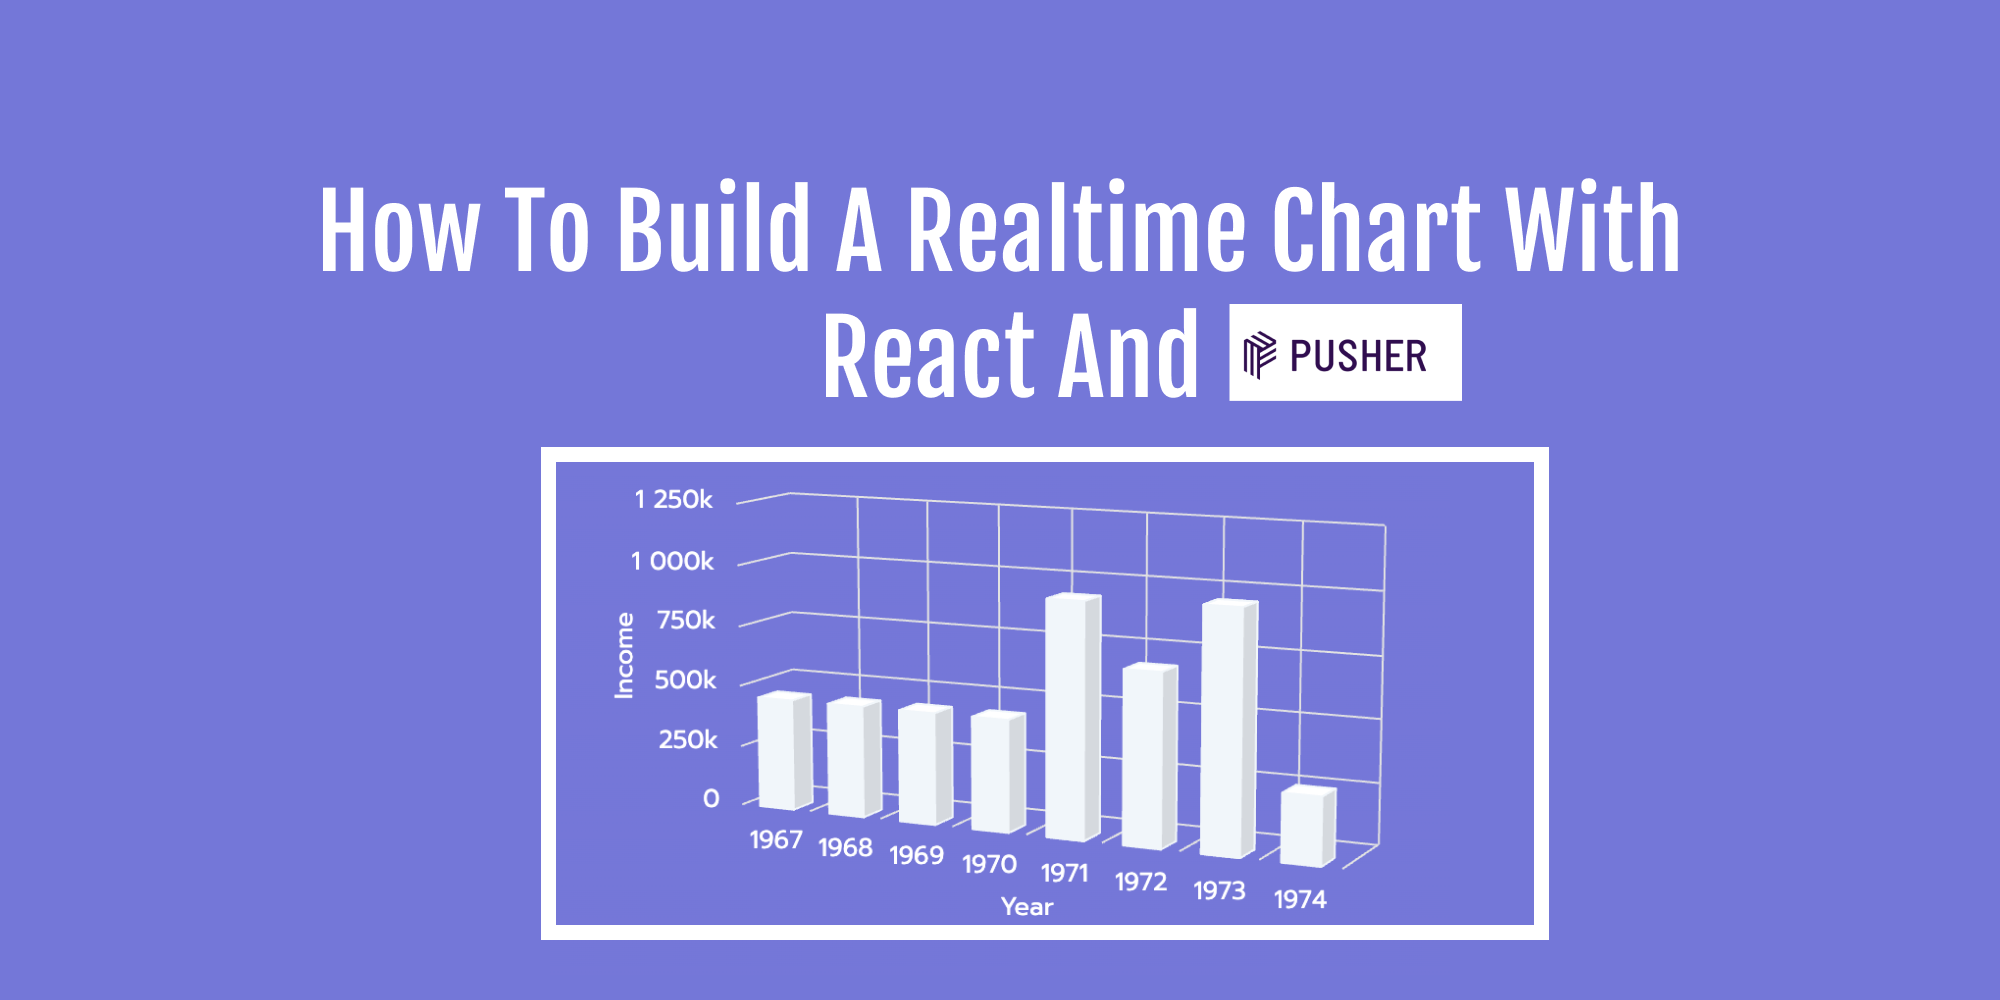
How to Build a Realtime Chart with React, HighCharts, and Pusher
#Angular
Chart.js Tutorial – How to Make Marimekko Charts in Angular
#charts
How to Create a Pivot Table in Excel
#Angular
How to Add the Chart.js Zoom Plugin to an Angular App
#charts
Line Charts Tutorial – How to Create a Line Graph in JavaScript
#Angular
Chart.js Tutorial – How to Make Bar and Line Charts in Angular
#charts
How to Think Less About Data Visualization
#charts
What is a Helm Chart? A Tutorial for Kubernetes Beginners
#charts
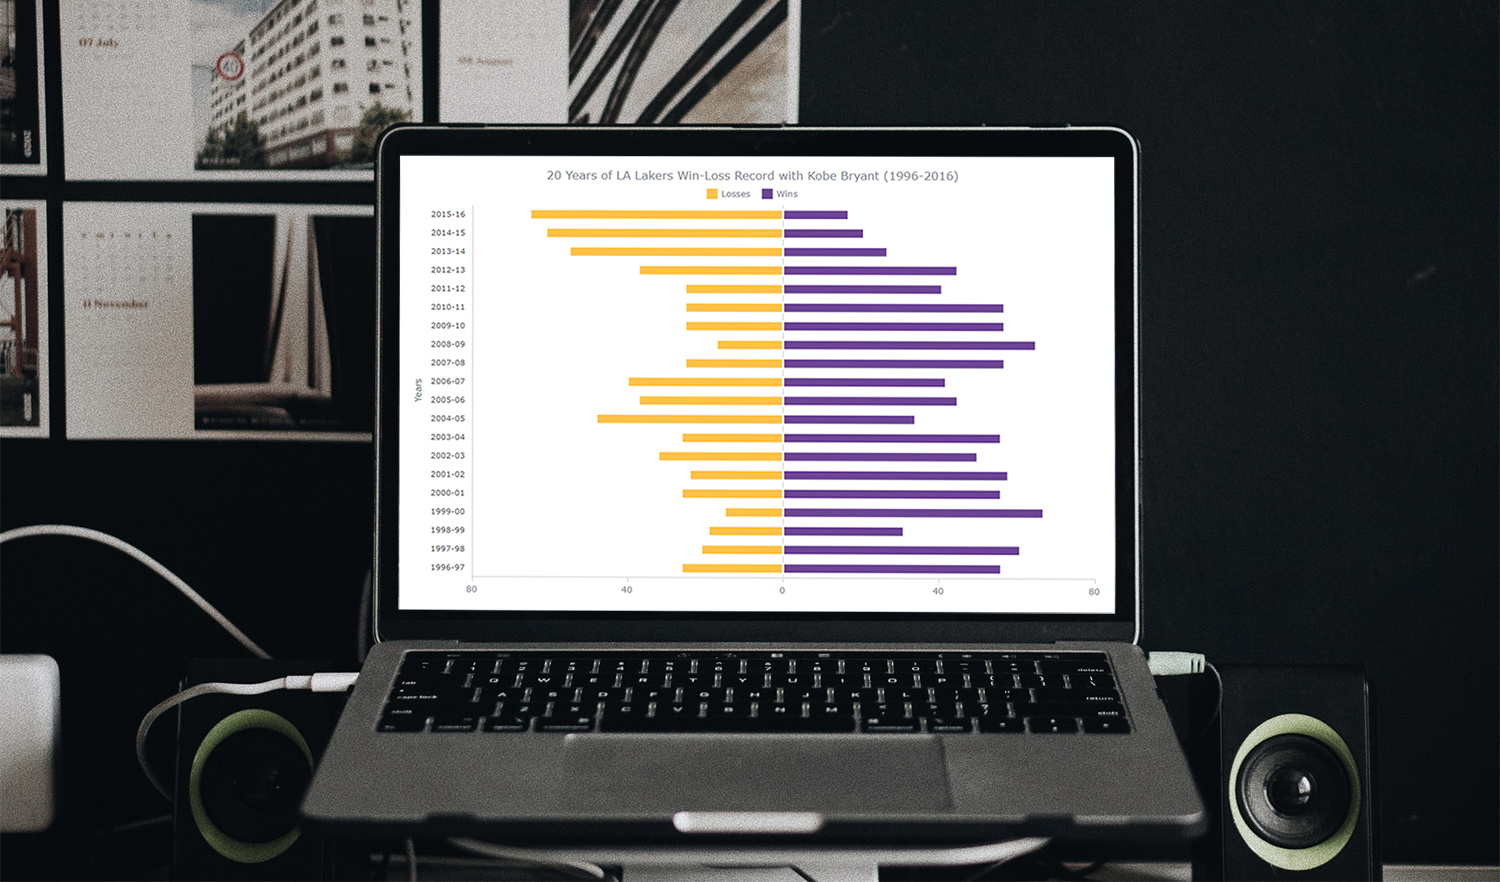
How to Create a Diverging Bar Chart with a JavaScript Charting Library
#charts
How to Integrate ApexCharts with Vue.js – a Detailed Guide
#charts
How to Create a Simple Gantt Chart Using CSS Grid
#charts
How to make your first JavaScript chart with JSCharting
#AWS
How to create serverless images using AWS lambda and ChartJS